Auto retailers are feeling the pain of a continued market slowdown – on top of significant macroeconomic uncertainty amid the war in the Middle East and surging oil prices. First-quarter performance amongst public auto retailers demonstrated a tough operating environment. However, there are a few reasons we remain optimistic in the long term:
- While optically concerning, unit sales faced a tough comp this quarter due to the pull forward in demand in Q1 2025, driven by tariffs. SAAR remains resilient despite economic uncertainty.
- New vehicle GPUs remain above pre-pandemic levels for the public auto retailers.
- Despite affordability challenges, there are still tactical opportunities in used vehicle sales.
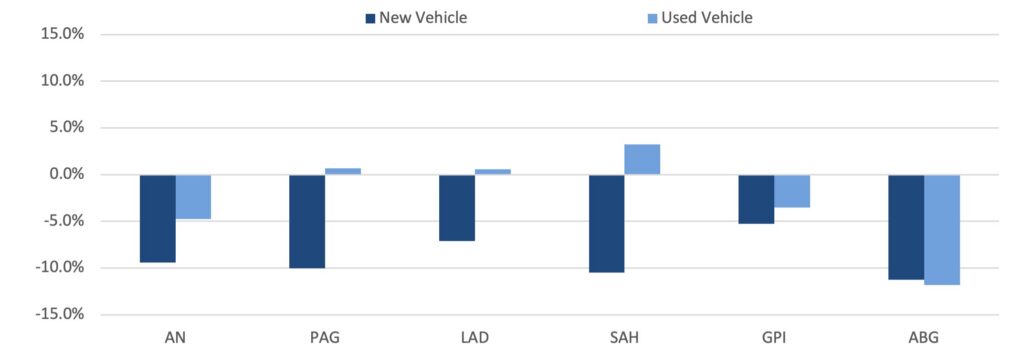
Growth in Unit Sales: In Q1 2026, public auto retailers reported year-over-year declines in same-store unit sales across both new and used segments.
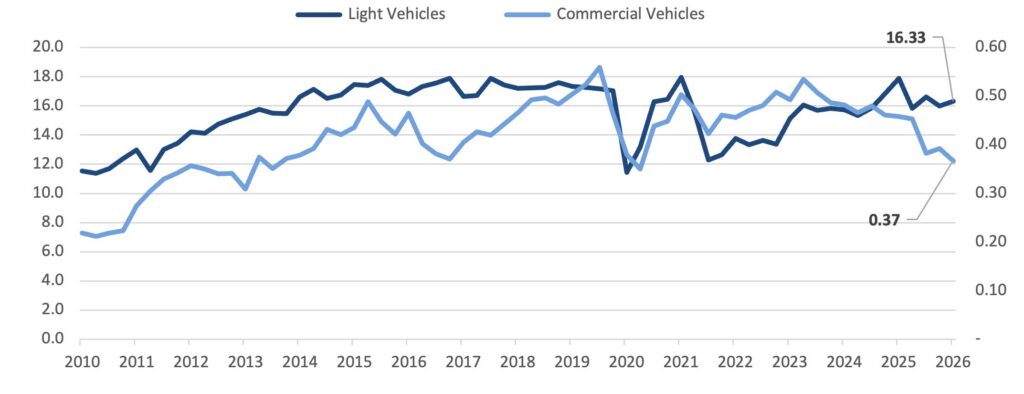
U.S. Vehicle Sales SAAR: Annual vehicle sales continue to trend above 16 million units despite broad economic uncertainty and record-low consumer sentiment.
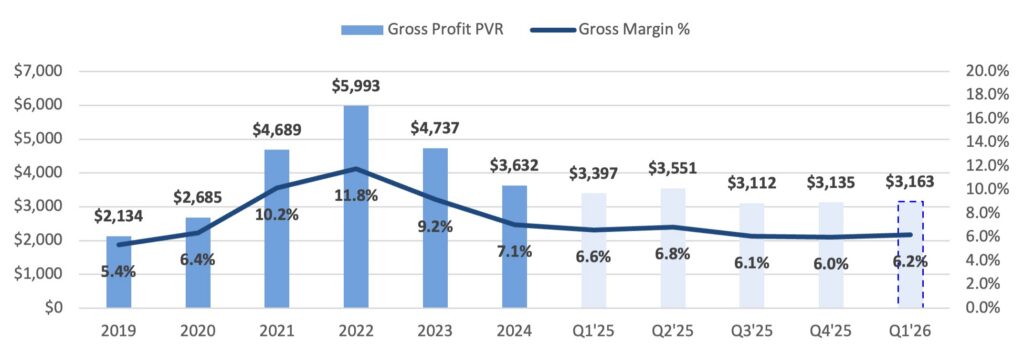
New Vehicle Profitability: Growth in gross PVR for new vehicles has outpaced inflation since 2019, as proxied by same-store PVR reported by public dealer groups.
Used Vehicle Strategy
We discussed the challenges of affordability in our Q4 2025 report, an issue that continues to be at the forefront of discussions for leaders across the industry. During this quarter’s earnings call, AutoNation’s CEO, Michael Manley, noted that affordability “is going to shape the overall industry volume for the foreseeable quarters that are coming at us.”
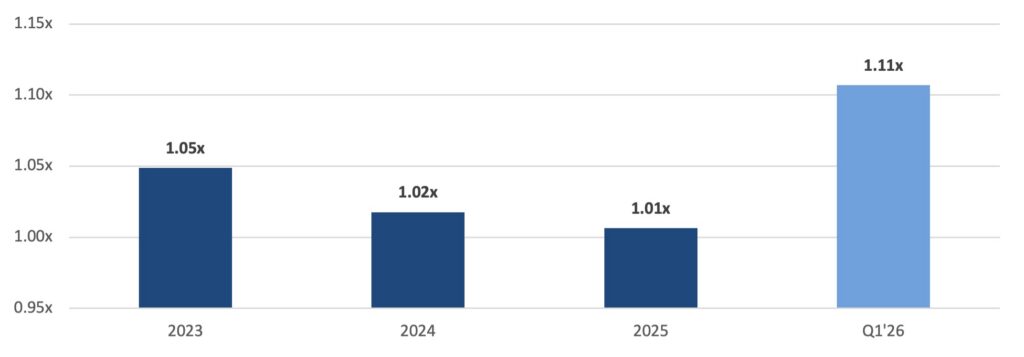
Our industry has turned its focus towards the used car market – anticipating outsized demand amid a continuing affordability crisis. This demand story is supported by anecdotes from the last quarter. The AutoNation team noted that used vehicle sales between $20,000-40,000 were up approximately 7% year-over-year while new vehicle sales declined 9.4%. This exemplifies a shift of would-be new vehicle customers shifting down to the more affordable used market. Dealer response to this demand is reflected in the used-to-new vehicle ratio for the public retailers, which shifted meaningfully towards used in the last quarter, relative to a balanced mix over the last three years.
Used-to-New Ratio
As we evaluate the used vehicle sales outlook, there are a few key themes:
Competitive Pressures in Used Inventory Sourcing
Trade-ins are the most profitable used car acquisition method. For example, Sonic generates an average of $1,200 of incremental GPU for used vehicles acquired by trade-in vs. auction. This market will likely become more competitive as:
- More dealers hone-in on the used car segment.
- Diminishing new vehicle sales constrain near-term trade-in activity for late model supply.
- Large used car retailers like Carvana and CarMax scale up acquisitions.
To offer more affordable vehicles to their customers, CarMax recently announced an effort to lower average selling prices – citing an average 50 basis point reduction in ASP during their last fiscal quarter. As such, leadership is focused on broadening inventory selection and pushing sales velocity. We expect this effort to translate into more aggressive acquisitions for CarMax, both through their online trade-in platform and at auction.
Off-Lease EV Supply Influx
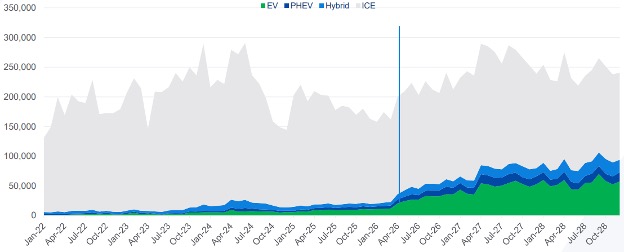
While the used market has benefited from tight supply, a rebound in lease maturities this year is expected to boost inventory. Cox Automotive estimates off-lease units will drive a 30%+ increase in used vehicle supply in 2026. Notably, a greater proportion of these vehicles will be EVs.
Estimated Lease Maturity Distribution
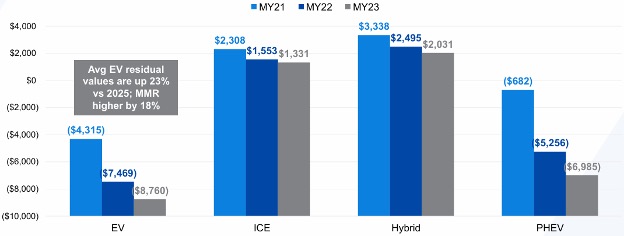
Lease equity is negative for EV units, which should result in a large share of lessees returning their vehicles and generating losses for OEMs (as leases are primarily originated by captive lending arms). A high percentage of these vehicles will likely come through auction.
Lease Equity by Fuel Type
This supply of off-lease EVs may create opportunities for dealers. The EV market is positioned to benefit from healthy fundamentals in the near-term.
On the demand side: Elevated oil prices will directly impact vehicle buying decisions. Used EVs will look like a deal to consumers, generating strong demand. This sentiment is supported by the data; a 2026 University of Michigan study found that buying a 3-year-old EV can yield savings of $13,000 vs. buying new, compared with $3,000 of savings for an ICE SUV.
On the supply side: New EV supply will be limited after several OEMs shuttered their EV programs.
While there are structural tailwinds in the used car market, a more competitive marketplace warrants a deeper understanding of the consumer, as well as a dynamic strategy for both acquisitions and sales.
Transactions & Valuations
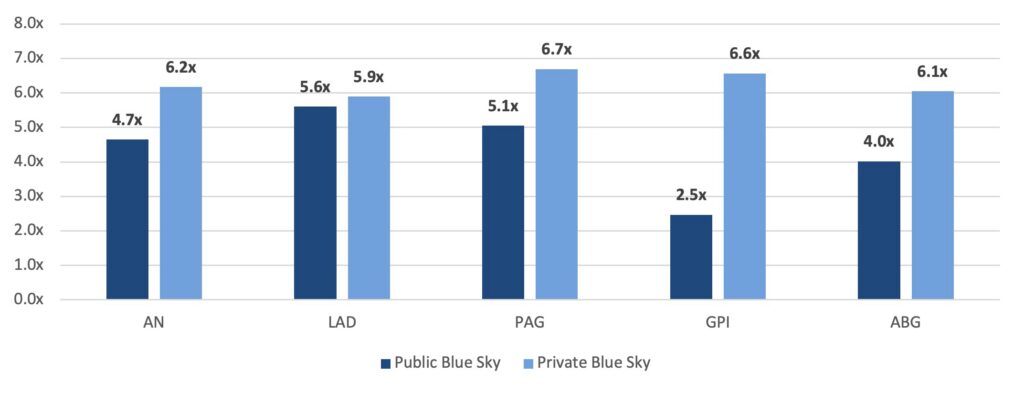
We continue to monitor goodwill valuations for the public auto retailers, which have fluctuated in line with the broader equities market. Many of the public groups continue to return capital to shareholders via large share repurchase programs. This signals management teams’ view that (i) their stock price is trading below intrinsic value and/or (ii) accretive acquisition opportunities in the private markets remain limited. This is reasonable given that public auto retailers continue to trade at a discount to where their portfolio may otherwise be valued in the private markets today.
Blue Sky Multiples