
Q4 2025 marked a normalization cycle for automotive retail, defined by softening unit volumes and margin compression. Our analysis explores the deepening affordability crisis and rising consumer credit stress while identifying strategic growth opportunities in used vehicle segments and fixed operations. We further examine the widening valuation gap between public and private markets. Navigating these cyclical headwinds will be necessary to lead in a transitioning market.
Downturn in New Vehicle Sales
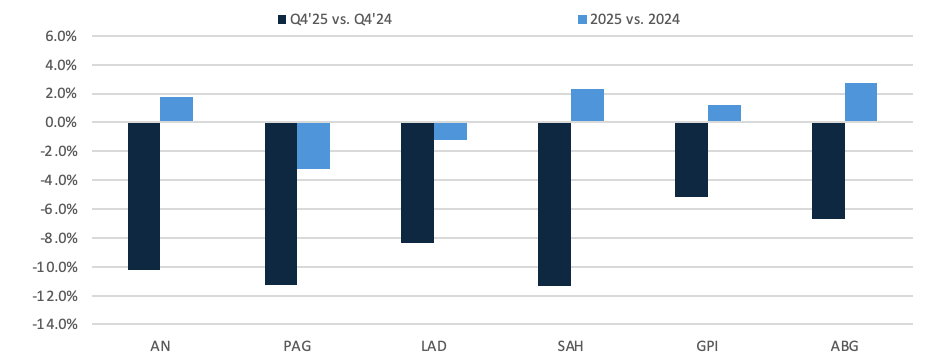
New vehicle unit sales fell markedly over the quarter, reflecting weaker consumer demand, inventory normalization, and the market settling after the Q3 pull-forward of demand post-expiration of the $7,500 EV federal tax credit. AutoNation, Penske and Sonic all reported double-digit declines in same-store new vehicle sales in Q4’25 compared with the same period in 2024. This slowdown is likely to continue into the new year; AutoNation is forecasting new car sales to be down between 2-5% in 2026.
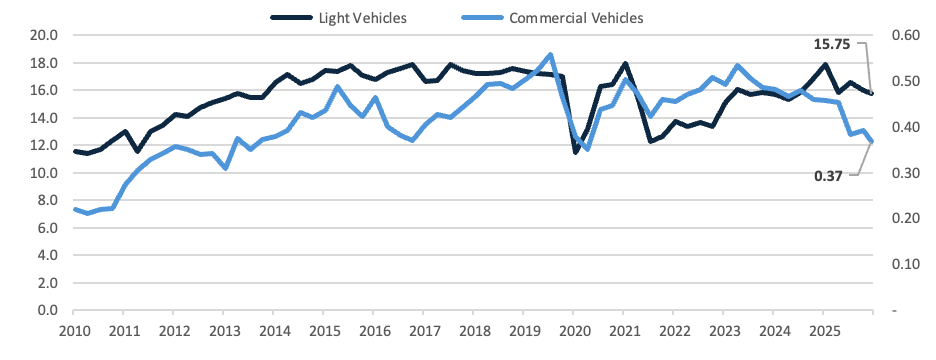
U.S. Vehicle Sales SAAR: Vehicle sales trend down in early 2026 from 16.3 million units in 2025
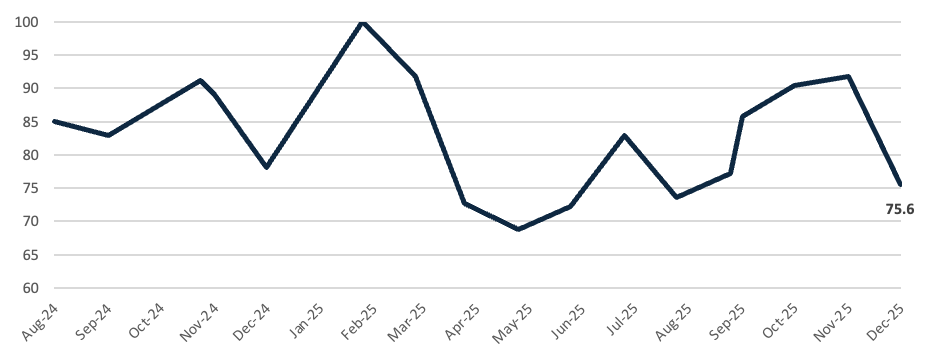
Days of Vehicle Supply: Inventory declined 8% in December, pushing supply down to 76 days
New Vehicle Sales: New vehicle unit sales down double-digits for several public auto retailers
Unit Sales Growth[1]
Challenges in Affordability and Consumer Health
Profitability remains challenged for new vehicles. Affordability is a real concern; the average price for a new vehicle surpassed $50,000 with average monthly payments over $750. With unemployment hovering just above 4%, consumer health has been stable, but some leading indicators are flashing warning signs.
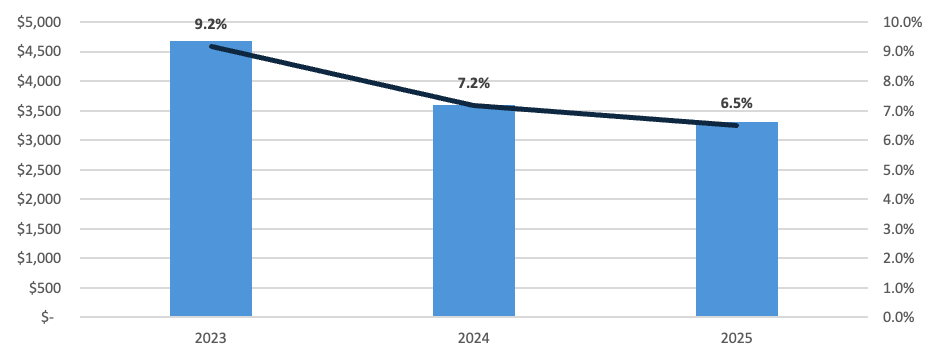
Gross Profit Per Vehicle Retailed[2]
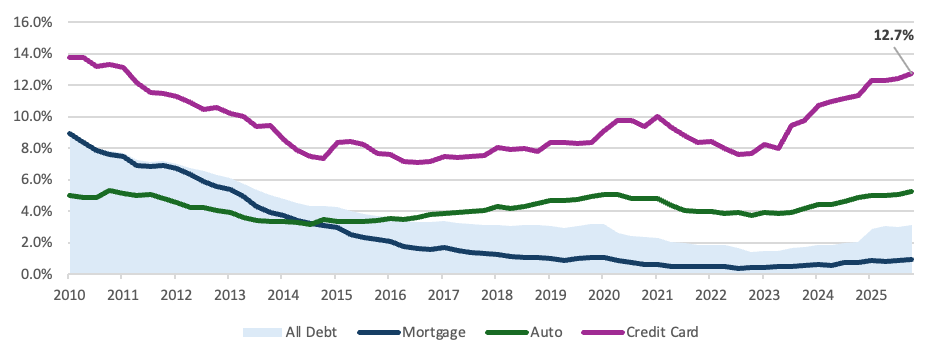
Persistent inflation in consumer prices (3.1% year-over-year growth as of January) has caused household balance sheets to deteriorate; personal savings rates have dropped to mid-4% relative to 7-8% historically. Credit card delinquencies (90+ days) have spiked to nearly 13% – levels consistent with the aftermath of the Great Financial Crisis – indicating unsustainable consumer spending levels. Further, the job market is starting to show cracks with 90,000+ job losses in February.
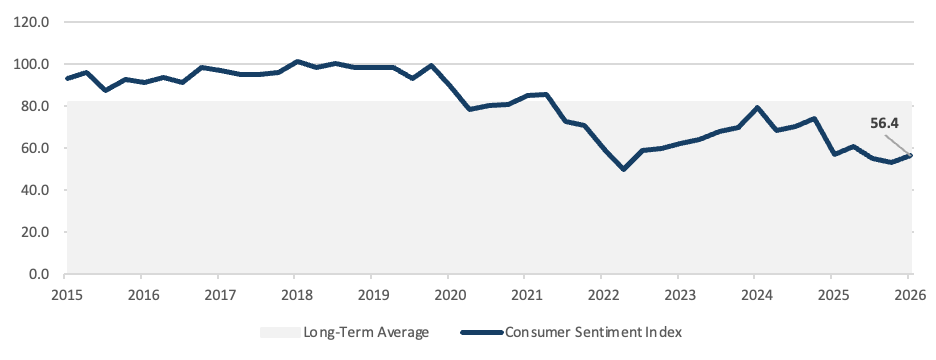
Credit stress will be segmented. Due to weaker disposable income levels and higher borrowing costs, low-income consumers will be the most impacted. For example, auto loan delinquencies are slightly elevated but driven mainly by subprime borrowers. Public dealer groups with financing arms (AutoNation, Lithia) remain confident in the health of their consumers, who tend to have higher FICO scores. At this point in the cycle, eroding consumer confidence is likely the biggest headwind to pricing power on new vehicles – leading higher-income buyers to look to used vehicles as an alternative.
Auto Loans: Delinquencies continue to tick up as financing rates remain elevated[3]
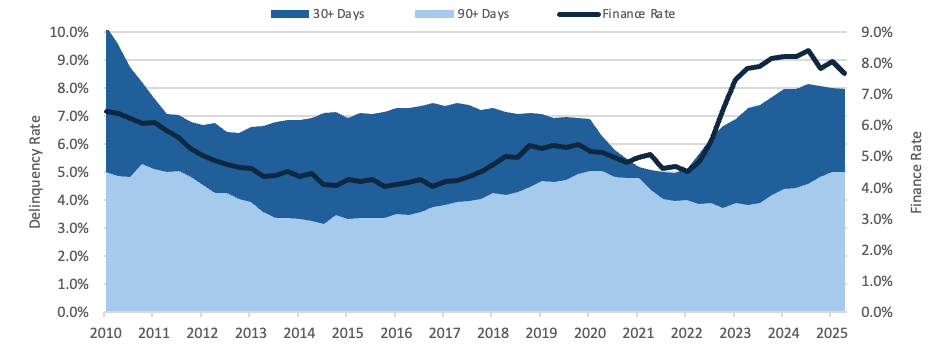
[3] Finance Rate based on 60-month, new vehicle consumer installment loans available from commercial banks; smoothed on quarterly basis
OEM Shifts
OEMs have messaged they will be disciplined on pricing this year. The manufacturers have been facing their own profitability challenges amid an ever-changing tariff regime. In the near-term, OEMs will likely protect their own margins and keep incentives low. Further, after largely overestimating EV adoption in the U.S., automakers (Stellantis, Ford, etc.) have taken some $55 billion in total write-offs related to cancelled or delayed EV programs.
These capital allocation missteps will present major issues for manufacturers’ product portfolios in the years to come. This, coupled with affordability concerns, may force OEMs to de-content or repackage new vehicle models within segments where demand is soft. These cyclical dynamics are likely to create a challenging year for new vehicle sales.
Navigating Opportunity in Used Vehicles and Fixed Operations
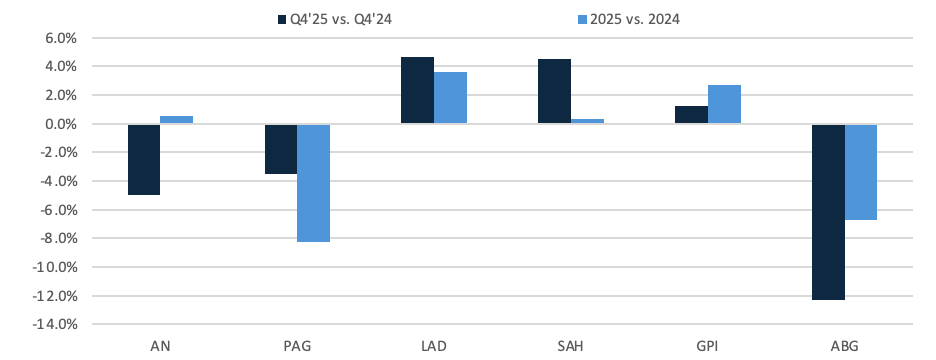
During this period of normalization, used vehicle segments present an opportunity. Inventory has tightened and consumer sensitivity should bolster demand. The public retailers continue to pursue opportunities in this space. For example, Lithia has focused on growing their “value autos” platform (vehicles over 9 years old, priced between $15,000-17,000) – and saw nearly 11% year-over-year growth in this segment for 2025. Despite over-expansion in the post-pandemic years, Sonic is now planning to accelerate marketing spend for EchoPark – the lowest cost provider in the used car market – which delivered record profitability in the quarter despite slower volumes. Targeting the right consumer will be critical to a successful used vehicle sales strategy.
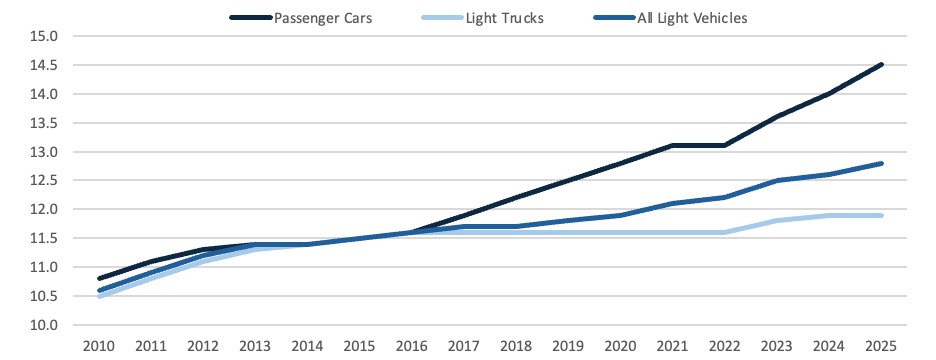
Average Age of Vehicles: Vehicle fleet reaches record age – boosting potential aftermarket demand
Used Vehicle Sales: Used vehicle sales demonstrate winners and losers amongst public auto retailers
Unit Sales Growth[1]
Gross Profit Per Vehicle Retailed[2]
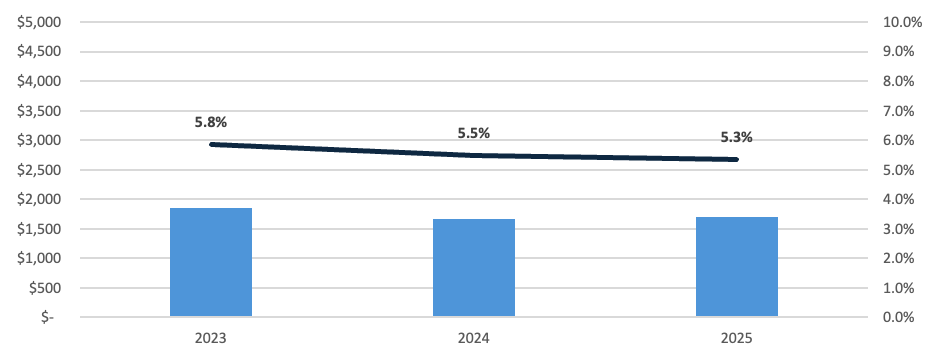
F&I and fixed operations continue to offset pressure from weaker front-end profits. Several public retailers reported mid-single-digit growth in service revenue and plan to grow technician headcount, underscoring the growing importance of the aftersales business as front-end margins compress. Top of Form
New Vehicle Profitability: New vehicle gross margins normalized to 6-7% during 2025[4]
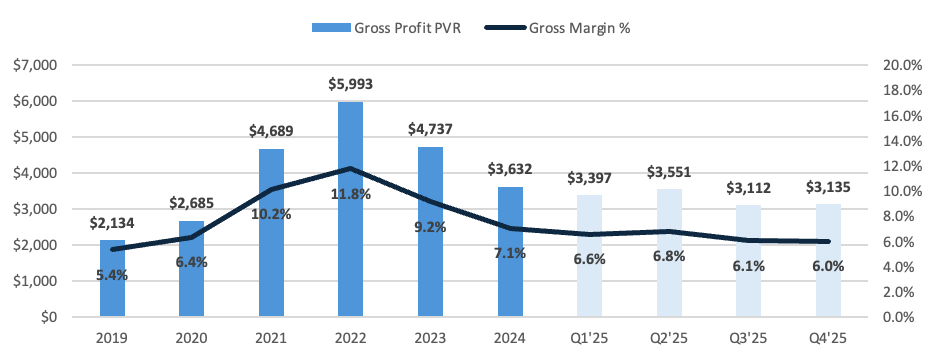
[4] Same-store gross profit per vehicle retailed and corresponding margin for AN, PAG, LAD, SAH, GPI, ABG; weighted by unit sales
Loan Delinquencies: Credit card delinquencies over 90 days have steadily climbed to nearly 13%
University of Michigan Consumer Sentiment: Consumer sentiment hits multi-year low
Transactions & Valuations
At WMK, we track the implied blue sky multiples of publicly traded auto retailers as an apples-to-apples comparison to private market dealership transactions. The blue sky multiple represents the franchise value of the dealership, excluding real estate and working capital. Please refer to our valuation build-up in the appendix below for a detailed explanation of how we derive this value.
Public and private markets continue to tell two different stories for auto retailers.
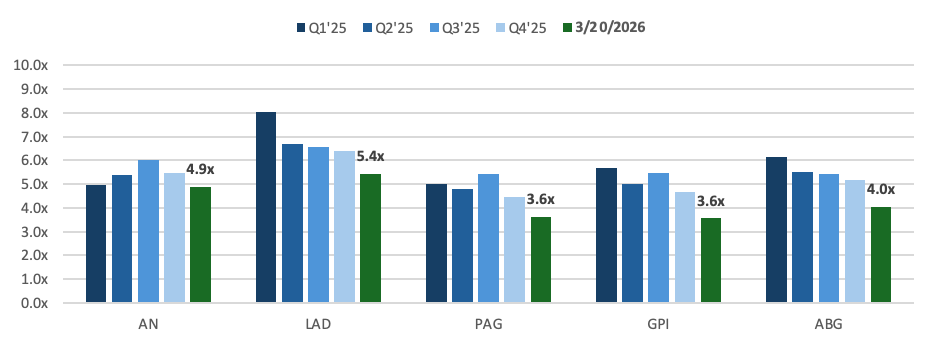
Valuations across public dealership groups have compressed year-to-date. Public markets tend to be short-term oriented – reacting to a challenged near-term profitability outlook. In contrast, private dealerships continue to trade at resilient multiples. Sophisticated private buyers are more bullish that dealer profits will remain structurally higher than pre-pandemic levels due to (i) disciplined inventory management and (ii) a focus on higher-margin segments like F&I and fixed operations.
While pricing remains robust, private market transaction volume has moderated. Haig Partners estimates 616 rooftops traded hands in 2025; the lowest level in the post-pandemic era. This likely signals a widening bid-ask spread, not necessarily a lack of liquidity. Buyers are grappling with increasing economic uncertainty and sellers are anchored to 2021-2022 peak valuations.
Private Market Analysis
Dealership Transactions by Rooftop: Dealership transaction volume continues to moderate
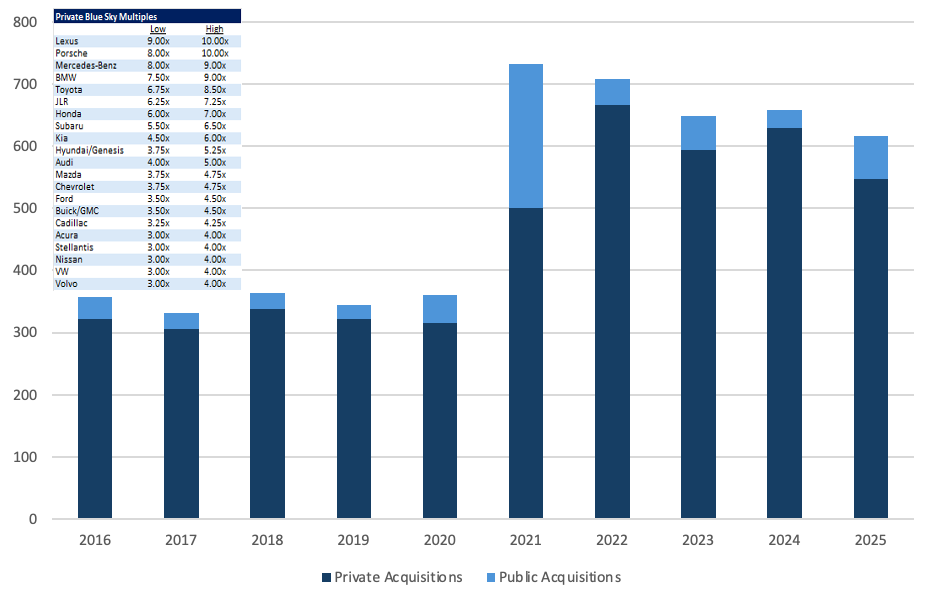
Source: Haig Report Q4 2025
Public Company Analysis
Median Blue Sky Multiple: Blue sky multiples compressed during the first quarter of 2026
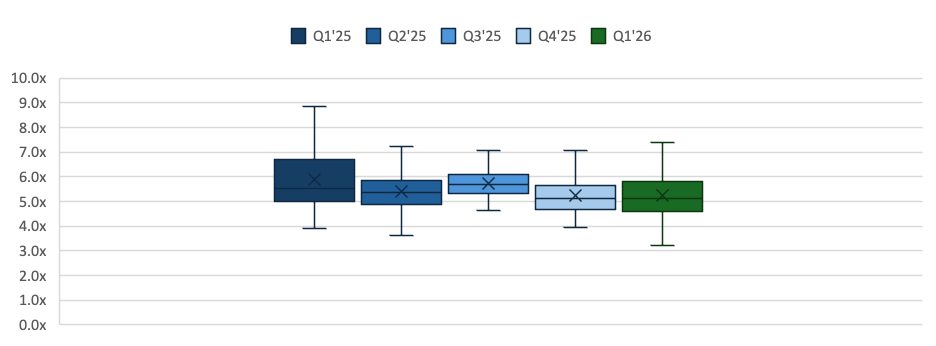
Blue Sky Distribution: Volatility spikes as the market reacts to cyclical headwinds, global turmoil
Blue Sky Time Series: Public auto retailers trade tighter in post-pandemic operating environment[5]
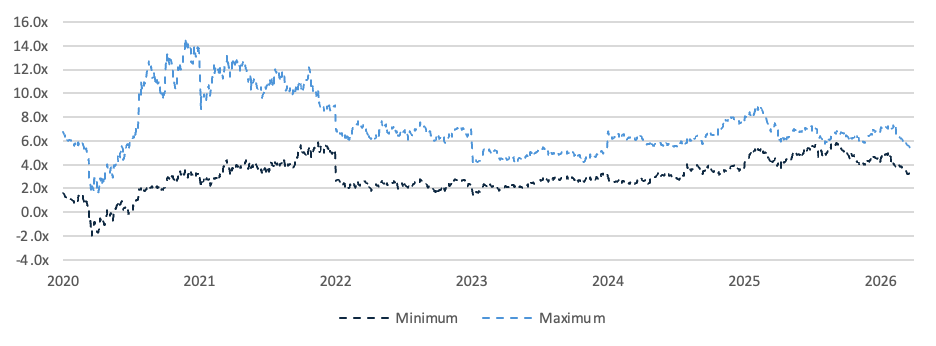
[5] Analysis excludes SAH due to the company’s non-traded dual class of Founder shares
Blue Sky Multiple Methodology–Lithia Motors (as of Q4’25)
The implied Blue Sky Multiple is comparable to private market dealershipvaluations by removing (i) real estate, (ii) inventory and (iii) non-dealership businesses from Enterprise Value and deducting estimated rent from owned real estate from Dealership EBITDA.
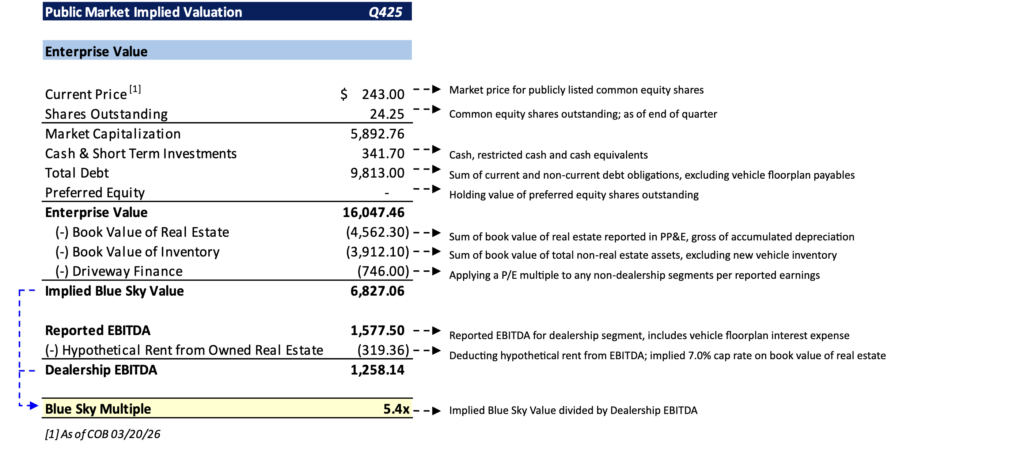
Methodology Breakdown: Lithia Motors (LAD) Blue Sky Calculation
- Enterprise Value: The calculation begins with a Market Capitalization of $5,892.76 million, adjusted for debt and cash to reach anEnterpriseValue of $16,047.46 million.
- Blue Sky Value Isolation: To determine the implied blue sky value, the methodology subtracts the book value of real estate($4,562.30M), inventory ($3,912.10M), and non-dealership businesses like Driveway Finance ($746.00M).
- EBITDA Adjustments: Reported EBITDA of $1,577.50 million is reduced by a hypothetical rent expense of $319.36 million (reflecting a7.0% cap rate on owned real estate) to arrive at a normalized Dealership EBITDA of $1,258.14 million.
- The Final Multiple: Dividing the Implied Blue Sky Value by the Dealership EBITDA results in a 5.4x Blue Sky Multiple.
Disclosures:
Investment advisory services are offered through WMKI Group LLC dba WMK Investment Partners, a Registered Investment Adviser. The views expressed represent the opinion of WMKI Group LLC. The views are subject to change and are not intended as a forecast or guarantee of future results. This material is for informational purposes only. It does not constitute investment advice and is not intended as an endorsement of any specific investment. Stated information is derived from proprietary and nonproprietary sources that have not been independently verified for accuracy or completeness. While WMKI Group LLC believes the information to be accurate and reliable, we do not claim or have responsibility for its completeness, accuracy, or reliability. Statements of future expectations, estimates, projections, and other forward-looking statements are based on available information and the WMKI Group LLC’s view as of the time of these statements. Accordingly, such statements are inherently speculative as they are based on assumptions that may involve known and unknown risks and uncertainties. Actual results, performance or events may differ materially from those expressed or implied in such statements. Investing in equity securities involves risks, including the potential loss of principal. While equities may offer the potential for greater long-term growth than most debt securities, they generally have higher volatility. International investments may involve risk of capital loss from unfavorable fluctuation in currency values, from differences in generally accepted accounting principles, or from economic or political instability in other nations.