
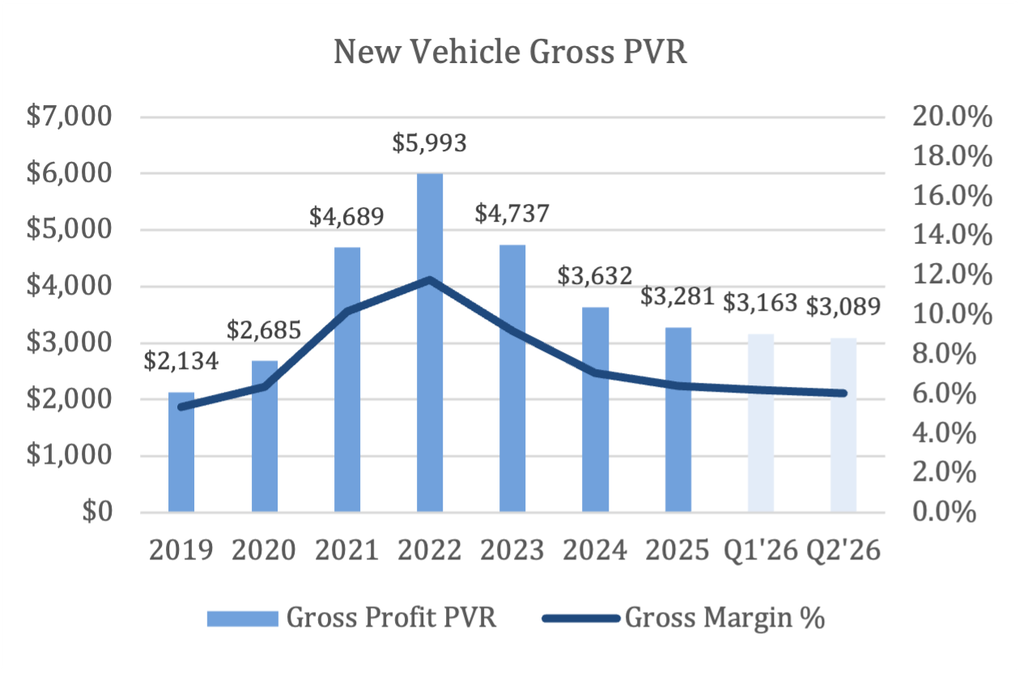
Affordability is the topic du jour. The conversations about affordability are not limited to automotive retail. Above target inflation and declining consumer sentiment continue to weigh on all industries. In their quarterly update call, Cox Automotive rationalized vehicle pricing hitting record highs; cars are better today than they were a decade ago, with more safety features and base model add-ons. In line with Cox’s sentiment, we demonstrate the resilience of the sector by comparing new vehicle gross PVR vs. consumer price index (CPI) over the last several years.
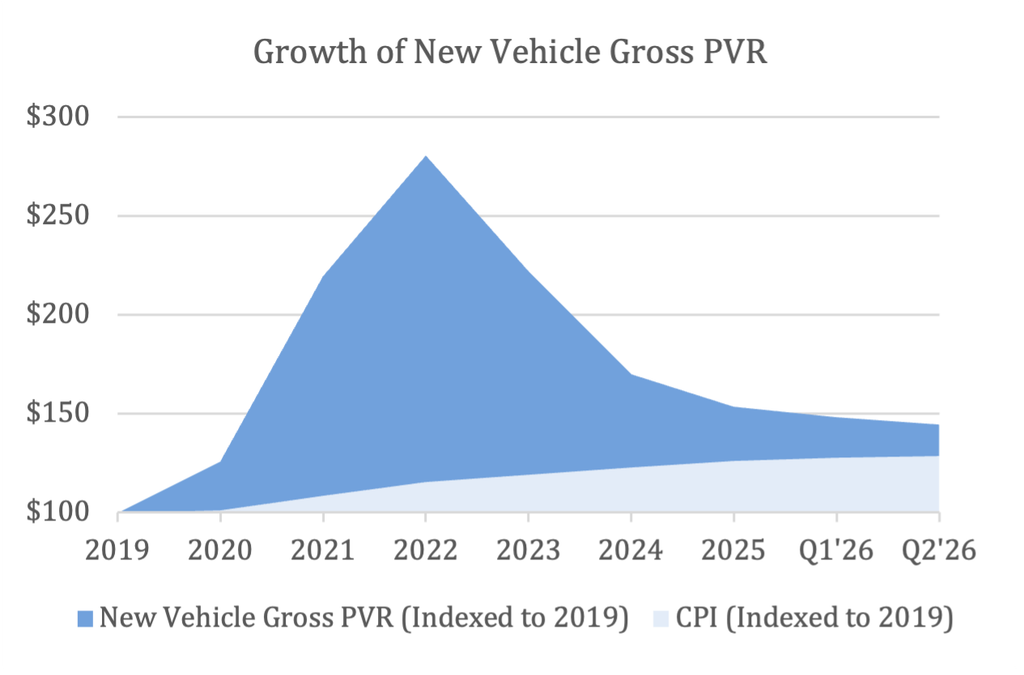
Gross margin on new vehicles has grown nearly 5.5% annually since 2019, compared to ~3.5% inflation over the same period. Despite lacking affordability, consumers are still buying new cars. However, there are signs of a stretched consumer:
- Nearly ¼ of new car buyers are extending their loan term to 84-months; a record high
- Average monthly payments on new vehicles remain elevated ($770+)
- A third of trade-ins are underwater ~$7,000 on average
We expect this to continue to weigh on sales or margins in both variable and fixed ops.
Productivity Enhancing Technology
In a difficult operating environment, business leaders focus on areas within their control: costs. This quarter, executives of public auto retailers focused on the topic of SG&A. In a business with high fixed costs, operating leverage is an important concept. As sales increase, a higher percentage of those sales drop to the bottom line. Automotive dealers can optimize their operating leverage by (i) improving the productivity of their personnel and (ii) the efficiency of their dollars spent on IT and advertising.
Implementing technology can improve productivity – the latest and greatest being artificial intelligence. This quarter, nearly all auto retail executive teams discussed their plans for rolling out new tech solutions. Namely, Asbury and Lithia provided data points worth calling out.
Asbury
Asbury is in the process of transitioning their DMS system to Tekion from CDK; roughly 70% of their stores have been transitioned. Key efficiencies are being driven by:
- Eliminating dozens of third-party integrations; and,
- Improving time to market, which is driving higher conversion rates in aftersales.
According to Asbury, the Tekion DMS integration is enhancing the customer experience and improving productivity for both variable and fixed ops. Asbury’s executive team provided two examples from stores that have been on the new system for at least 5 months: (i) a 12% increase in units per sales manager and (ii) a 10% increase in dollars per technician.
Friction costs are critical. During the transition, Asbury’s stores have been less efficient due to DMS downtime and operational improvements are taking between 5-6 months to come to fruition.
Lithia
Lithia is implementing Pinewood.AI across their U.K. stores and are starting to reap the benefits. In the U.K., Lithia reported 200bps of SG&A improvement in the quarter. These gains are mainly driven by reduced personnel costs. For example, Pinewood.AI eliminated 447,000 work hours which resulted in $10-11mm in cost efficiencies.
During this quarter’s earnings call, Lithia President & CEO Bryan DeBoer discussed how they expect to achieve their sub-60% SG&A target:
“I’m going to guess that half of the cost savings to get us to a sub-60% level are going to come from AI solutions. The other half are going to come from job combinations, multiple functions, scale-level improvements on procurement, as well as other vendors as well as these remote functions as we move into a world that is looking towards convenience, simplicity and empowerment from the consumers.”
Productivity Scenario Analysis
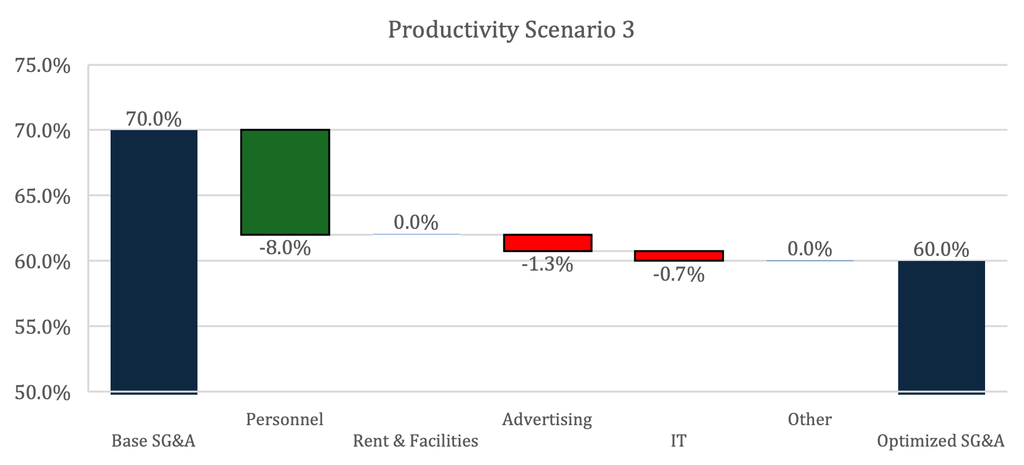
Utilizing these limited data points, we demonstrate scenarios which bridge SG&A costs from 70% to 60% of gross margin. Our key assumptions are:
- Level of sales and gross margin are maintained with fewer but more productive personnel;
- More efficient targeted advertising reduces overall ad spend; and,
- Net IT savings from more powerful software systems driven by AI, reducing the volume of third-party providers.
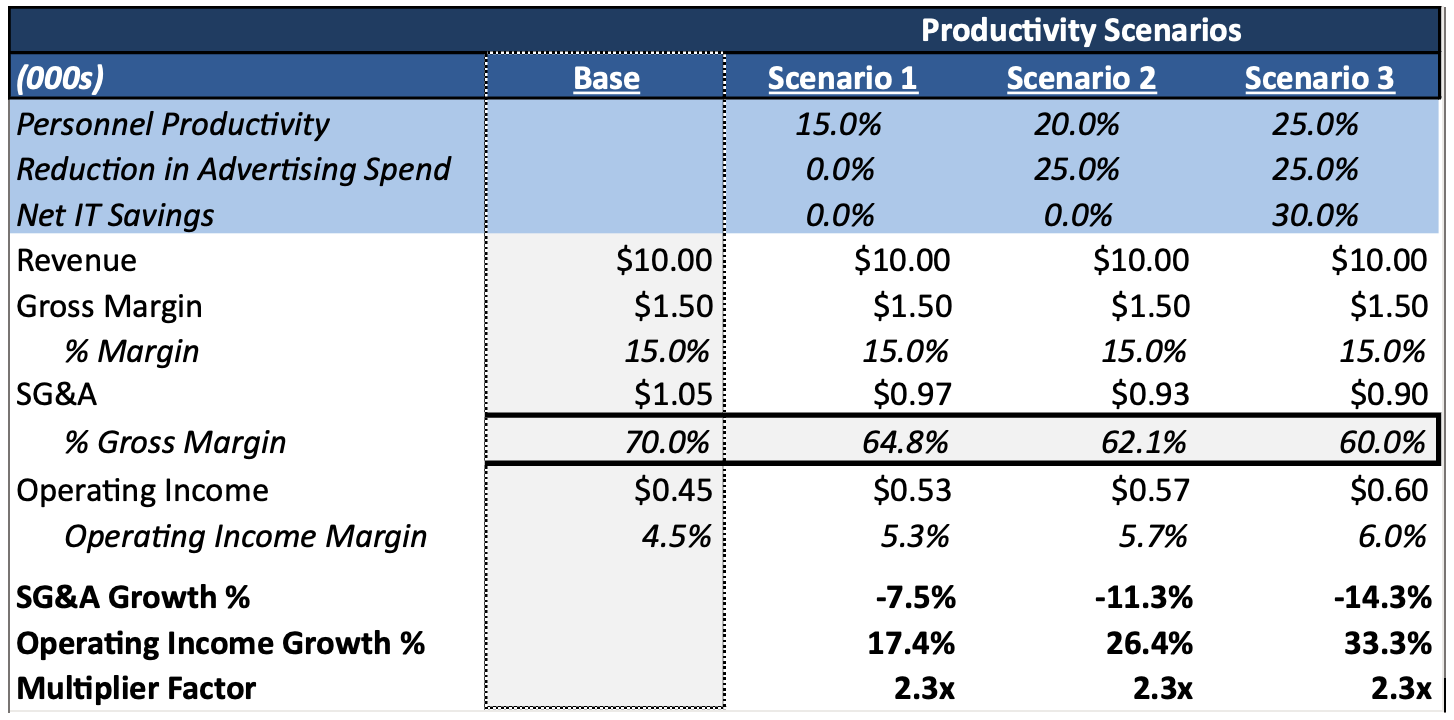
Scenario 1 may be achievable today. Asbury reported a ~15% increase in units sold per manager. If a dealership could achieve 15% productivity improvement in personnel across the board, it would drive a 7.5% reduction in SG&A and a nearly 18% improvement in operating income. This extreme growth in operating income demonstrates a 2.3x cost efficiency multiplier embedded in this high operating leverage business model.
There is less evidence supporting Scenarios 2 and 3. To achieve 60% SG&A, dealers would need to achieve a 25% increase in personnel productivity, a 25% reduction in advertising spend and a 30% reduction in IT spend. This is a big leap, and likely not achievable by AI alone. There would need to be other structural efficiencies – perhaps enabled by AI – such as combining jobs to permanently reduce personnel overhead.
We would be remiss not to mention two key downsides of our oversimplified analysis:
- We focus only on the cost side of the equation; as Lithia’s team noted, while unquantified today, AI will drive further gains in top line and gross margin.
- We ignore technology and friction costs of implementing AI solutions, and how these costs might change over time as winners in the automotive AI space emerge.
The former is the real catalyst to drive material upside. The latter is the biggest unknown.
Transactions and Valuations
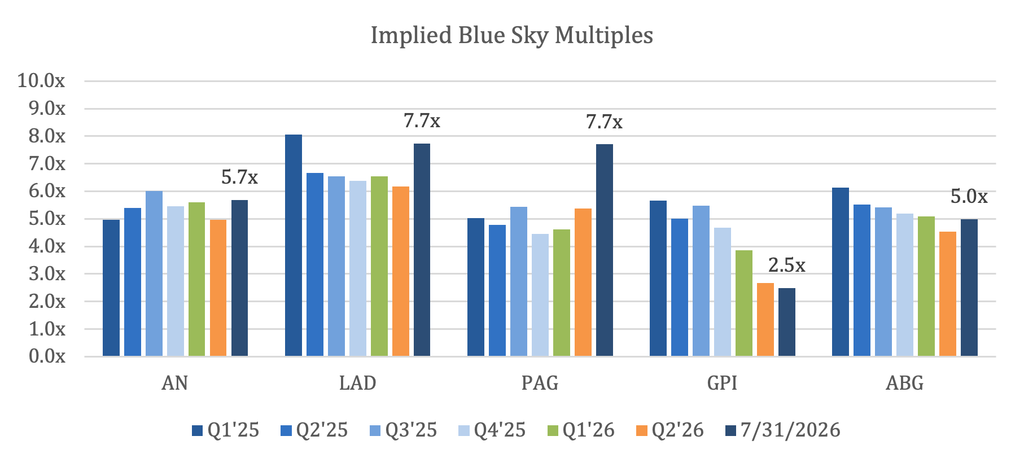
Valuations of the public auto retail groups diverged during the Q2 earnings season.
- The market appears to be bullish on Lithia’s implementation of Pinewood.AI in the U.S., which has 10x the expense structure of its U.K. operation.
- Penske Corp and Mitsui, the controlling shareholders of Penske, have offered $3.8Bn ($210 per share) to take the group private, which is now reflected in PAG’s share price.
- Valuations of other retailers remained mostly unchanged from prior quarters.
Median quarterly blue sky multiples implied by public markets are below, with July 31st reflecting post-earning season valuations:
Disclosures
The views expressed above are those of WMK Investment Partners. These views are subject to change at any time based on market and other conditions, and WMK disclaims any responsibility to update such views.
Past performance is not indicative of future performance. Principal value and investment return will fluctuate. There are no implied guarantees or assurances that the target returns will be achieved, or objectives will be met. Future returns may differ significantly from past returns due to many different factors. Investments involve risk and the possibility of loss of principal. The values and performance numbers represented in this report do not reflect management fees.
WMK may discuss and display, charts, graphs, formulas which are not intended to be used by themselves to determine which securities to buy or sell, or when to buy or sell them. Such charts and graphs offer limited information and should not be used on their own to make investment decisions. To the extent that certain of the information contained herein has been obtained from third-party sources, such sources will be cited, and are believed to be reliable, but WMK has not independently verified the accuracy of such information.