
Economic Chartbook Review
Objective: In our comprehensive economic update for the second quarter of 2026, WMK has curated a series of economic data points meant to provide an overview of global asset class performance, macroeconomic fundamentals, and valuation metrics to guide long-term investment strategy.
Tactical Review: These data points help inform investors on current market conditions, highlighting risks and opportunities regarding markets, yields and consumer health.
Decision Support: The report is intended to contextualize recent volatility against historical averages to help investors maintain a disciplined, fundamental value perspective.
Fed Policy
- The Federal Reserve is stuck between a rock and a hard place on the path of interest rates. Employment remains steady but CPI has spiked its highest level since 2023.
- During his first Fed meeting as chairman, Kevin Warsh failed to give rate guidance and indicated that he plans to respond to the market; a reversal in course relative to Fed strategy during the Powell-era.
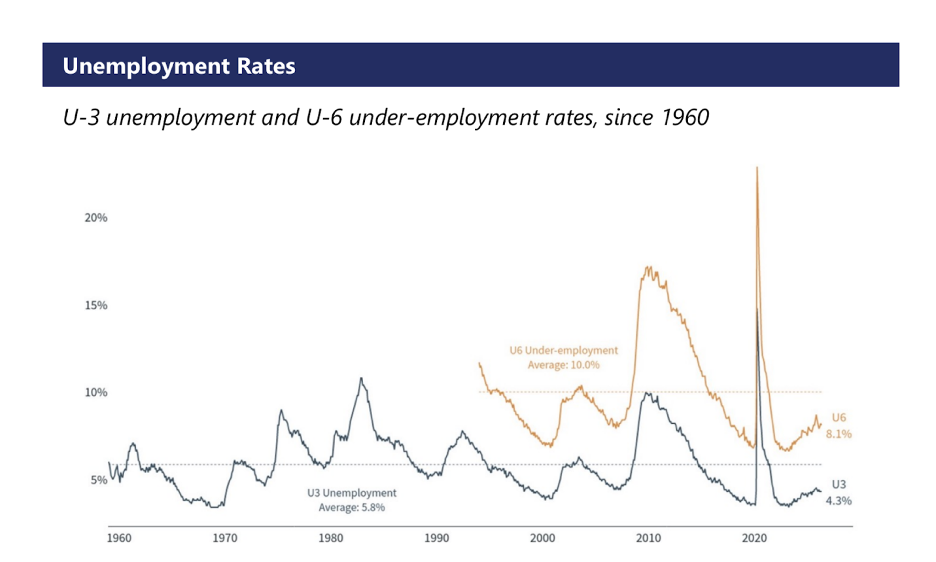
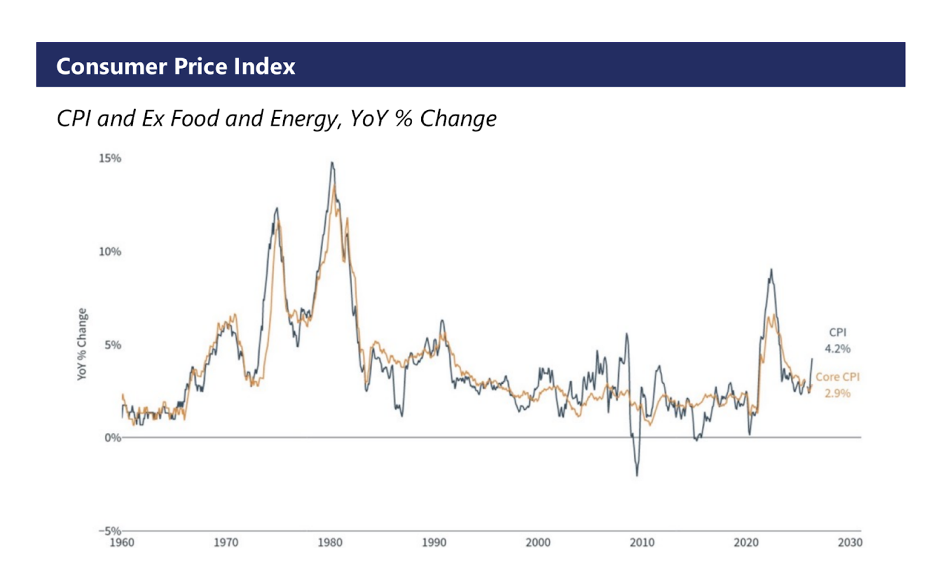
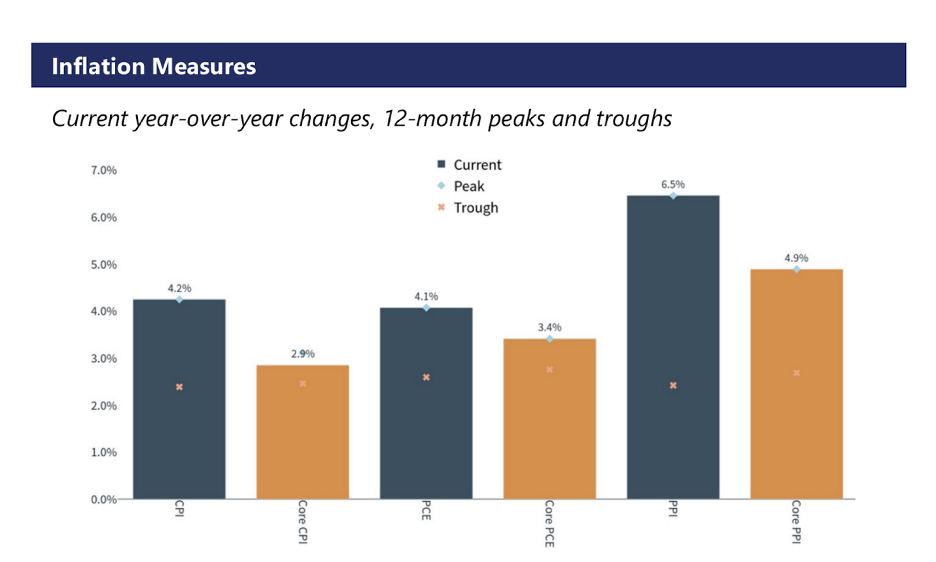
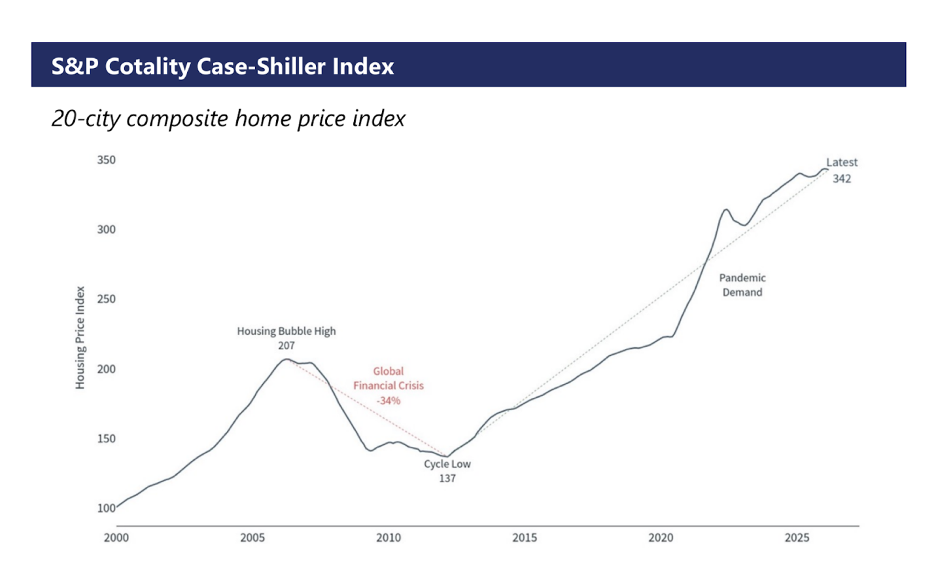
Source: Clearnomics, Bureau of Labor Statistics, Bureau of Economic Analysis, University of Michigan
Consumer Health
- There remains a bifurcation between consumer balance sheets and spending behavior vs. how consumers are feeling, reflecting affordability stress.
- Negative sentiment is a leading indicator of an economic downturn, as consumers shift their behavior and reduce spending.
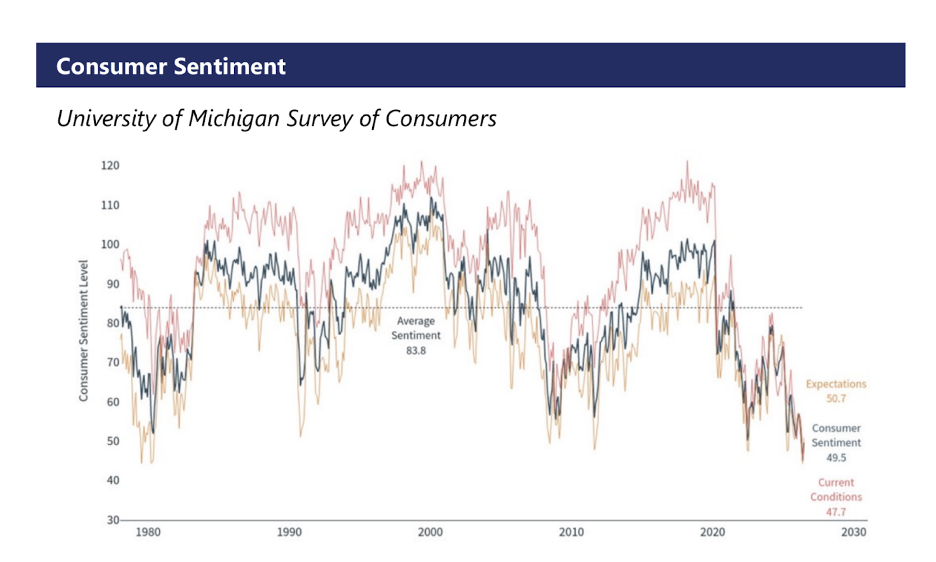
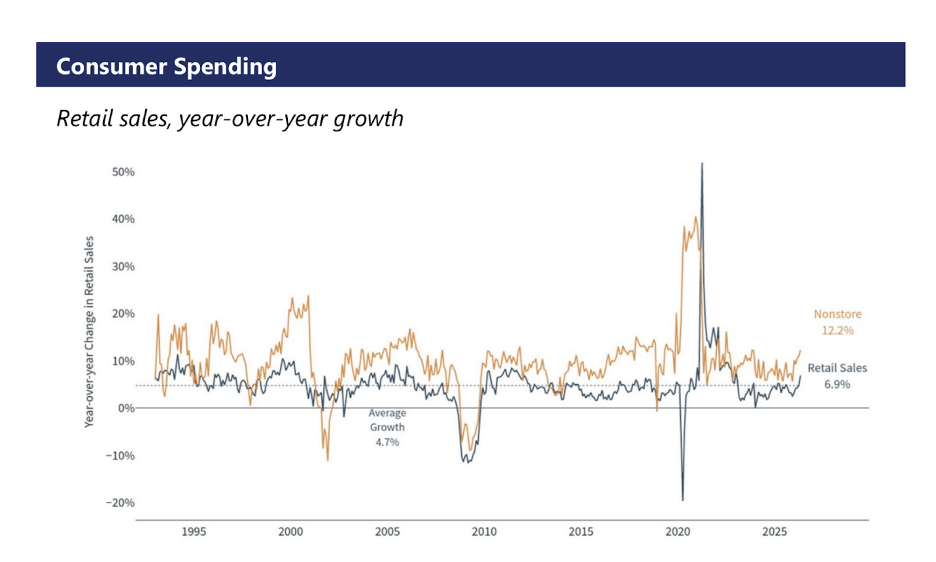
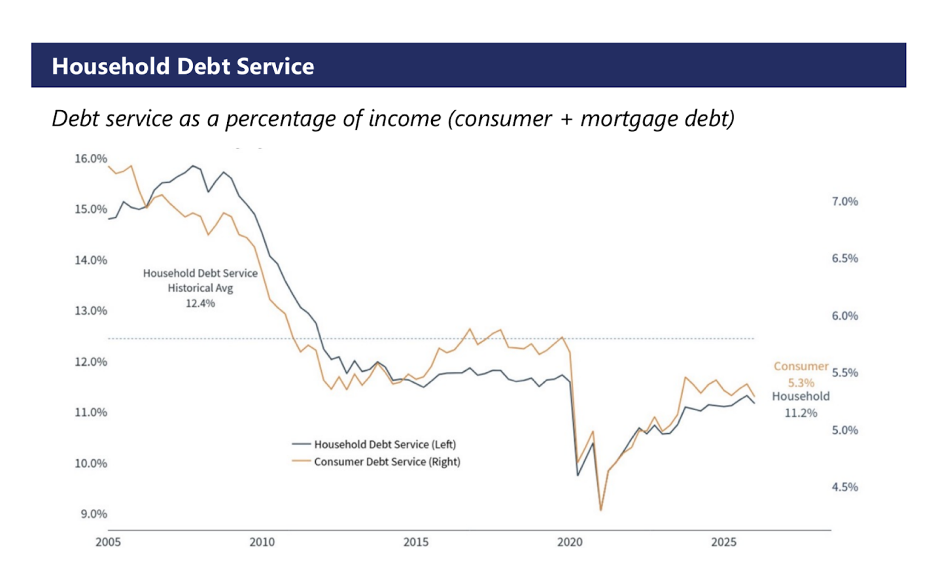
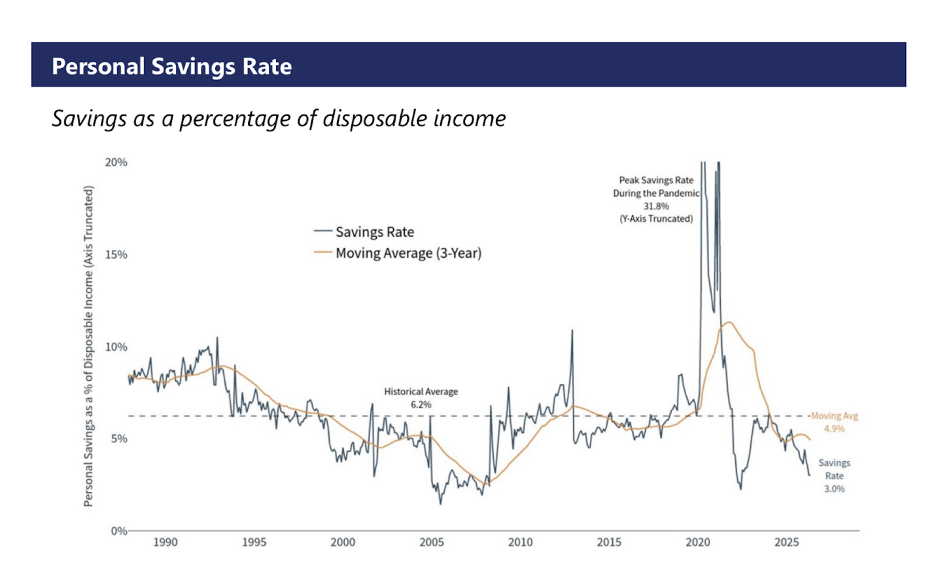
Source: Clearnomics, University of Michigan, Federal Reserve, U.S. Census Bureau, Bureau of Economic Analysis
Housing Market
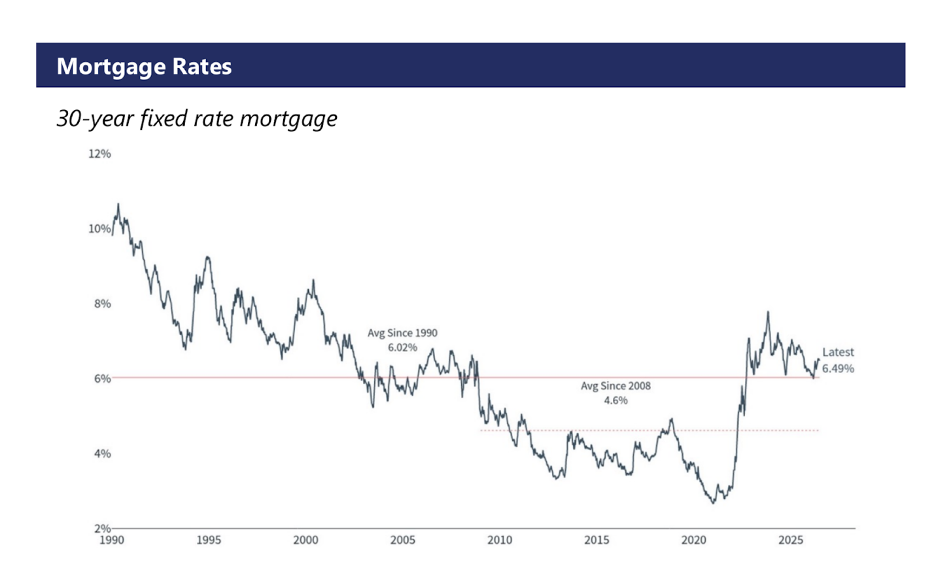
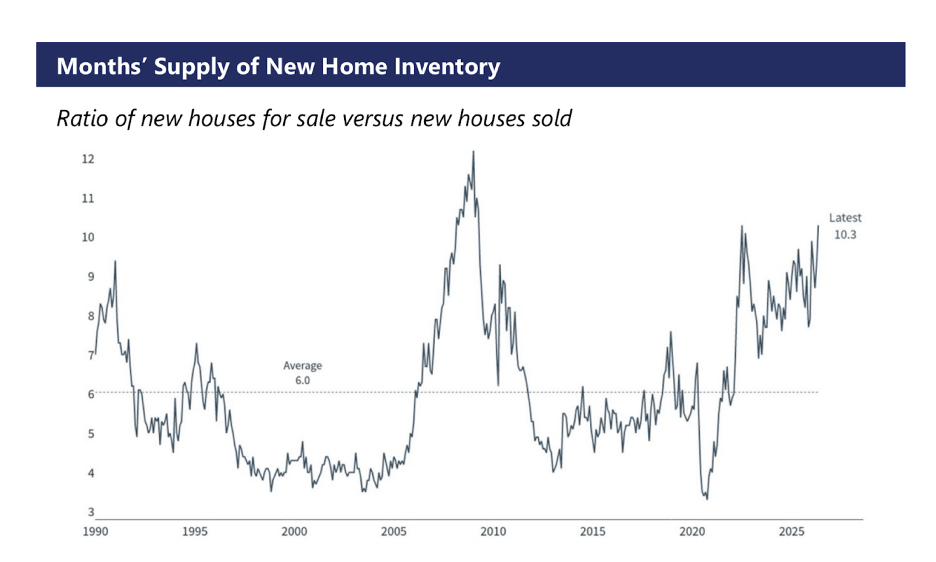
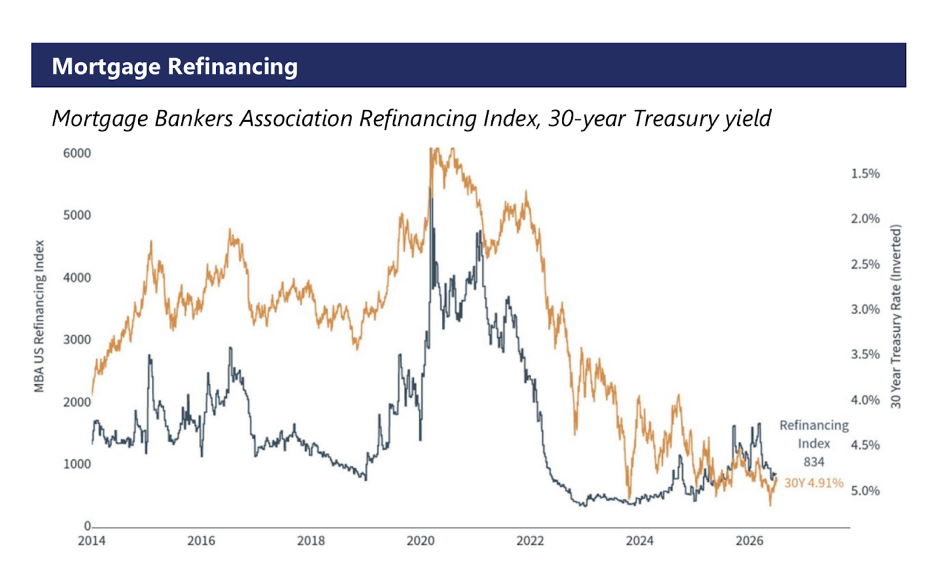
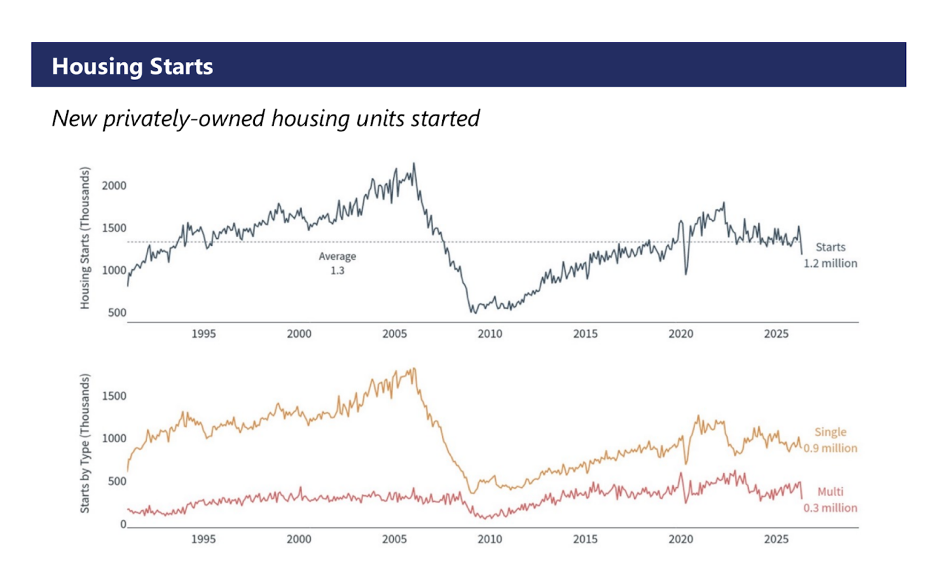
- Elevated mortgage rates are stifling activity in new home purchases, mortgage refinancings and new housing construction.
- For-sale housing inventory continues to build despite slowing construction starts. Home prices remain elevated, but this may indicate a softening housing market ahead.
Source: Clearnomics, Freddie Mac, Federal Reserve, Mortgage Bankers Association, National Association of Realtors, U.S. Bureau of the Census
Automotive Impact
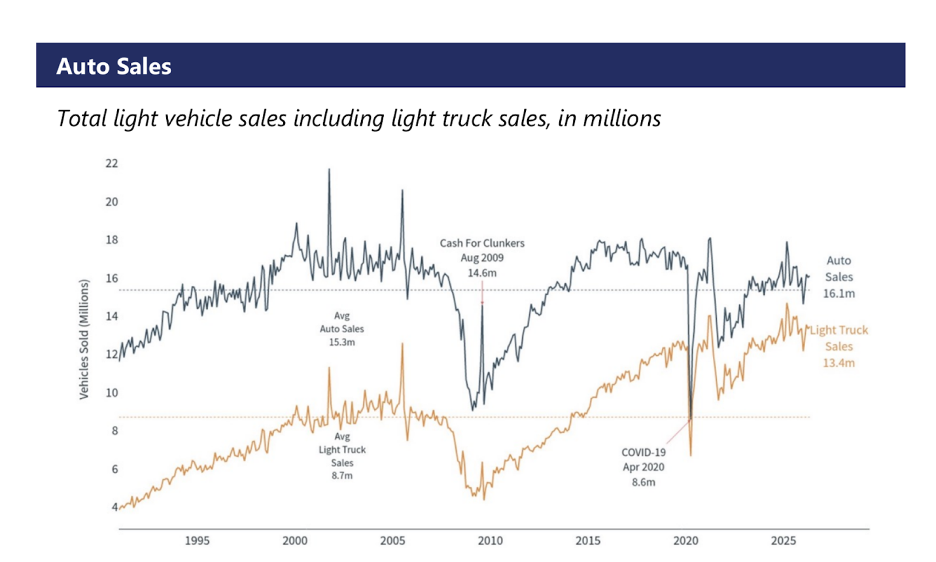
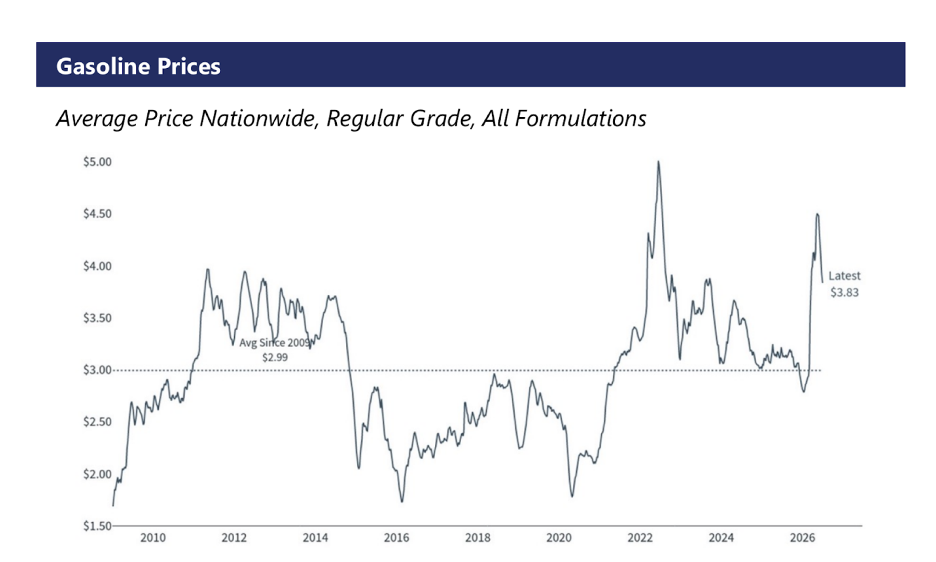
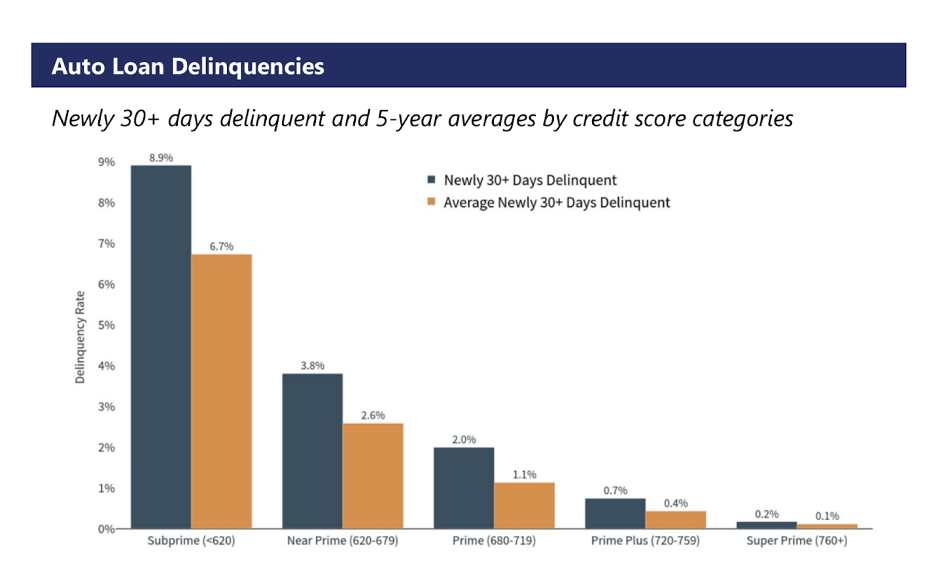
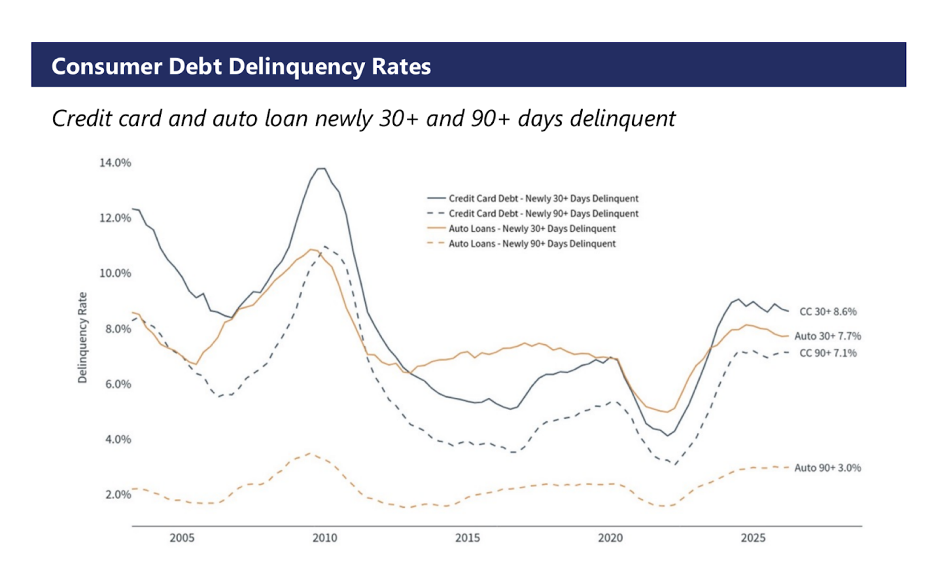
- The automotive market has not been immune from affordability stress. Consumers are lengthening auto loans at record levels; nearly 37% of new car buyers took a 6+ year loan during the second quarter. Average monthly car payments are now upwards of $770. A stretched consumer may precede distress in consumer and auto debt.
Source: Clearnomics, Bureau of Economic Analysis, U.S. EIA, Federal Reserve
Bond Markets
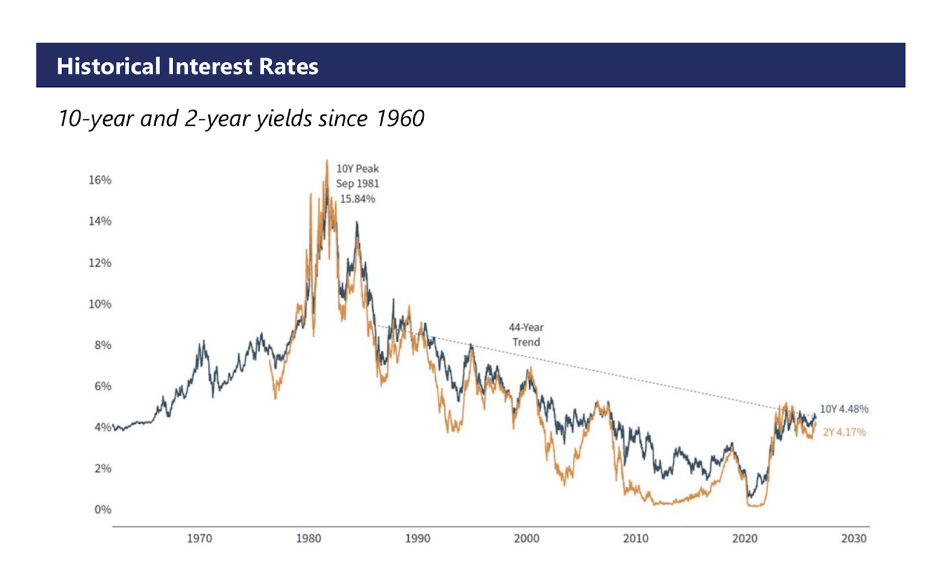
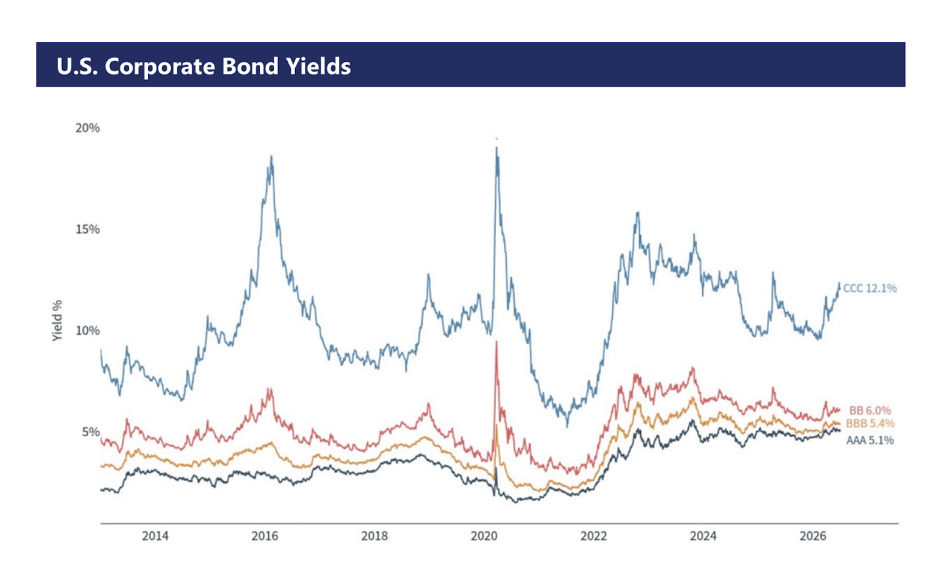
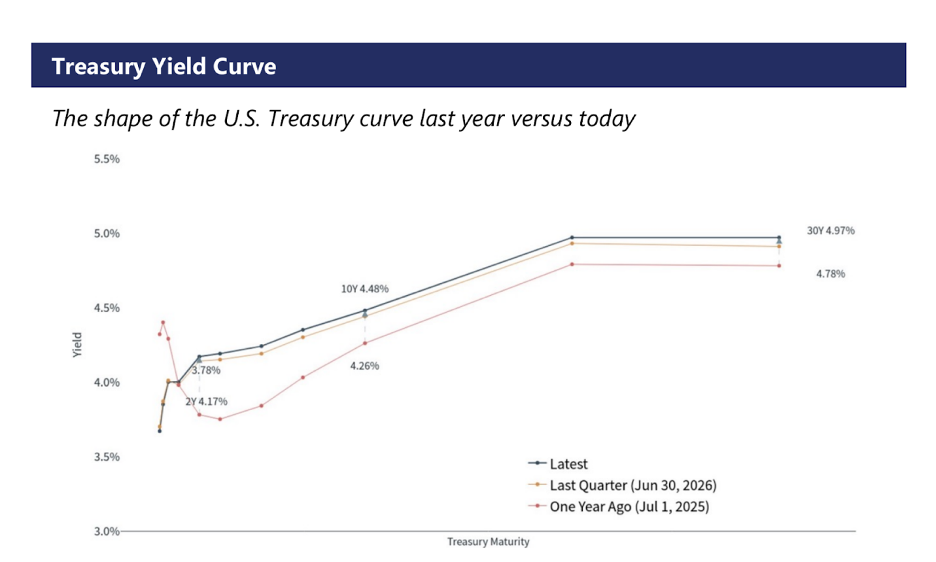
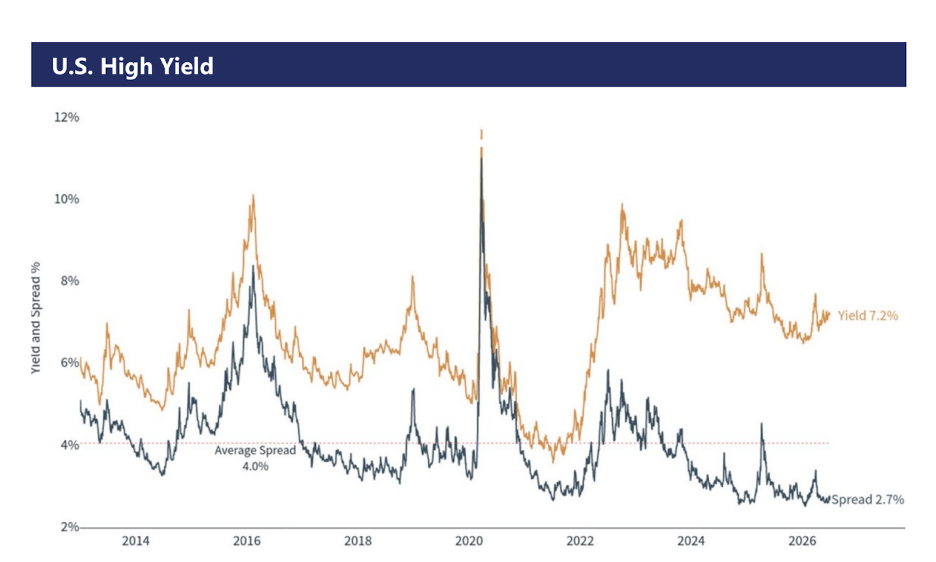
- Corporate and high yield bonds are still priced to perfection. Yields continue to tick up but spreads to U.S. Treasuries remain at their lowest levels since the 1990s.
Source: Clearnomics, Federal Reserve, Bloomberg
Equity Markets
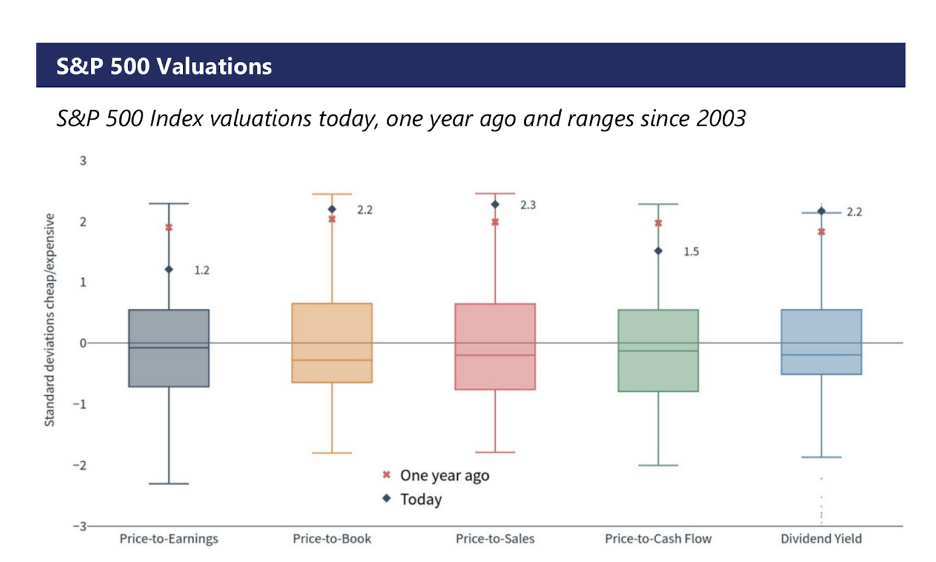
- Like the bond markets, the equity risk premium for owning stocks relative to U.S. Treasuries is near zero. Overall, investors are not being rewarded for holding risker equities.
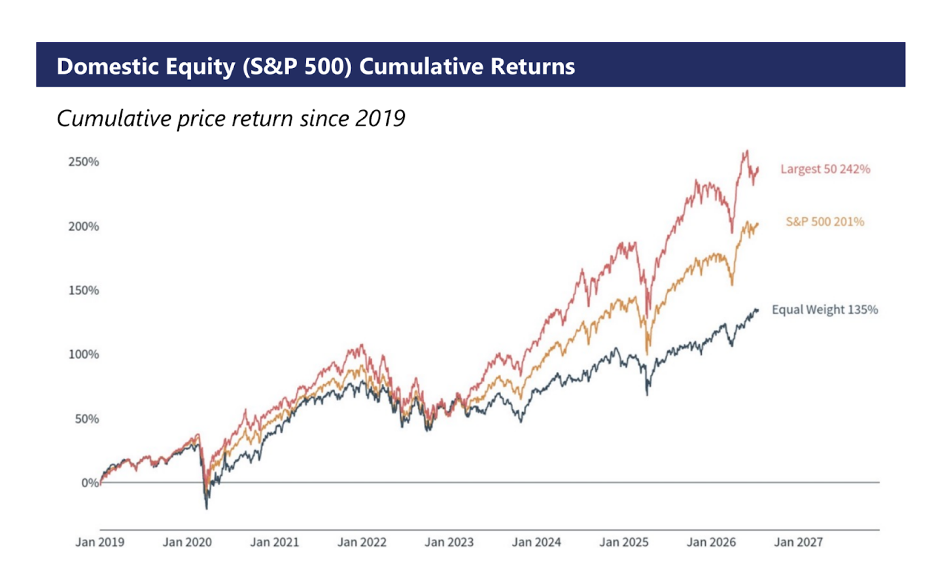
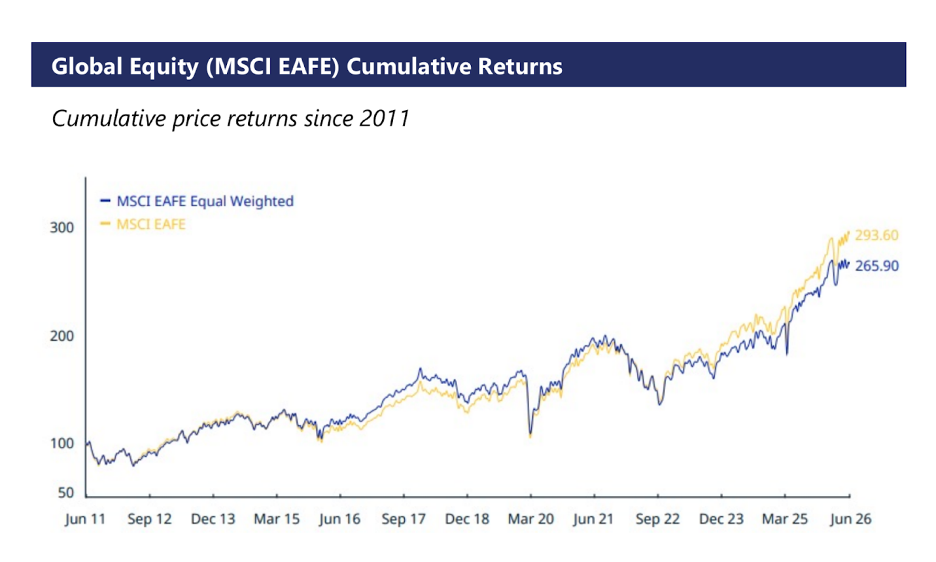
- During this cycle, market cap weighted returns have outpaced equal weighted returns across both US and international equities; reversing a long-term trend. Domestically, this has been primarily driven by mega-cap tech concentration – i.e., the Magnificent Seven.
Source: Clearnomics, Standard & Poor’s, LSEG, MSCI
Asset Class Performance
Total Returns and annual averages over the period shown
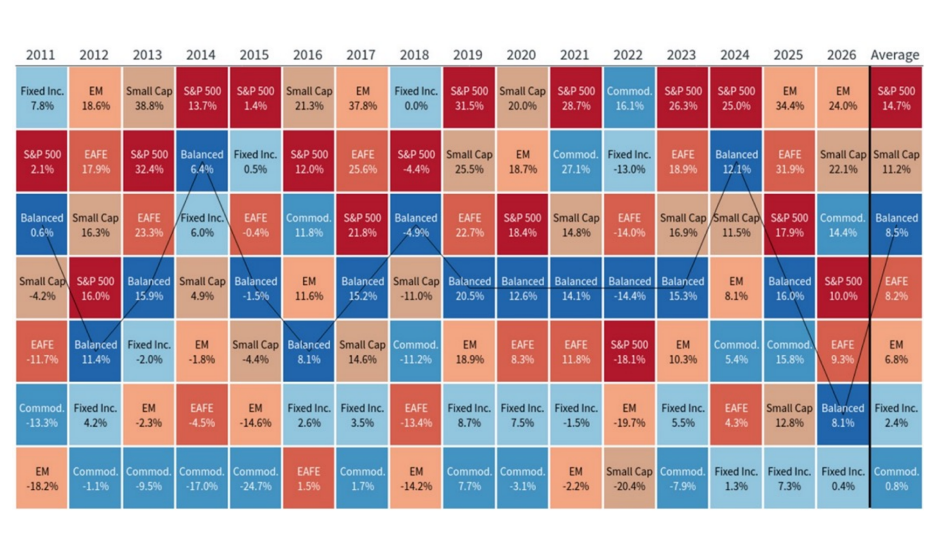
The Balanced Portfolio is a 60/40 historical index calculation consisting of 40% U.S. Large Cap, 5% Small Cal, 10% International Developed Equities, 5% Emerging Market Equities, 35% U.S. Bonds, and 5% Commodities.
Source: Clearnomics, LSEG
About WMK Investment Partners
WMK Investment Partners was purpose-built to solve the limitations of rigid financial institutions and conventional advisory models. Founded by entrepreneurs who built and scaled businesses firsthand, we experienced the need for an investment partner that combines real-world operational insights with institutional-quality capital allocation. We were our first clients and remain deeply invested in the exact strategies we recommend—ensuring our personal capital is fully aligned with yours. Operating with a long-term orientation that thinks in decades rather than quarters, we deliver disciplined investment management and bespoke solutions tailored to the complexities of concentrated wealth and mission-driven organizations.
Today, we serve a select group of growth-oriented families, business owners, and institutions. Whether serving as an Outsourced Chief Investment Officer (OCIO) for family offices and endowments, optimizing reinsurance structures and liquidity for automotive dealerships, or guiding entrepreneurs through complex business transitions, our agility and owner-operator perspective allow us to react strategically to unique opportunities. We prosper when our clients do, providing the stewardship, clarity, and discipline required to build and preserve enduring value across generations.
Disclosures
WMKI Group, LLC (“WMKI”) dba WMK Investment Partners is an SEC registered investment adviser located in Colorado. WMKI may only transact business in those states in which it is registered or qualifies for an exemption or exclusion from registration requirements.
This presentation is limited to the dissemination of general information regarding WMKI’s investment advisory services. Accordingly, the information in this presentation should not be construed, in any manner whatsoever, as a substitute for personalized individual advice from WMKI. Information presented is for educational purposes only and does not intend to make an offer or solicitation for the sale or purchase of any specific securities, investments, or investment strategies. Investments involve risk and unless otherwise stated, are not guaranteed. Be sure to first consult with a qualified financial adviser and/or tax professional before implementing any strategy discussed herein. Any client examples are hypothetical and used to demonstrate a concept.
Past performance is not indicative of future performance. Therefore, no current or prospective client should assume that future performance of any specific investment, investment strategy (including the investments and/or investment strategies recommended by WMKI), or product referenced directly or indirectly in this presentation, will be profitable. Different types of investments involve varying degrees of risk, and there can be no assurance that any specific investment or investment strategy will be suitable for a client’s or prospective client’s investment portfolio.
Various indexes were chosen that are generally recognized as indicators or representation of the stock market in general. Indices are typically not available for direct investment, are unmanaged and do not include fees or expenses. Some indices may also not reflect reinvestment of dividends.