
Economic Chartbook Review
Objective: WMK has curated a series of economic data points meant to provide an overview of global asset class performance, macroeconomic fundamentals, and valuation metrics to guide long-term investment strategy.
Tactical Review: These data points help inform investors on current market conditions, highlighting risks and opportunities regarding markets, yields and consumer health.
Decision Support: The report is intended to contextualize recent volatility against historical averages to help investors maintain a disciplined, fundamental value perspective.
Consumer Health
- The health of the consumer drives the long-term performance of businesses that construct the stock market. It is hard to have a deep recession with healthy employment.
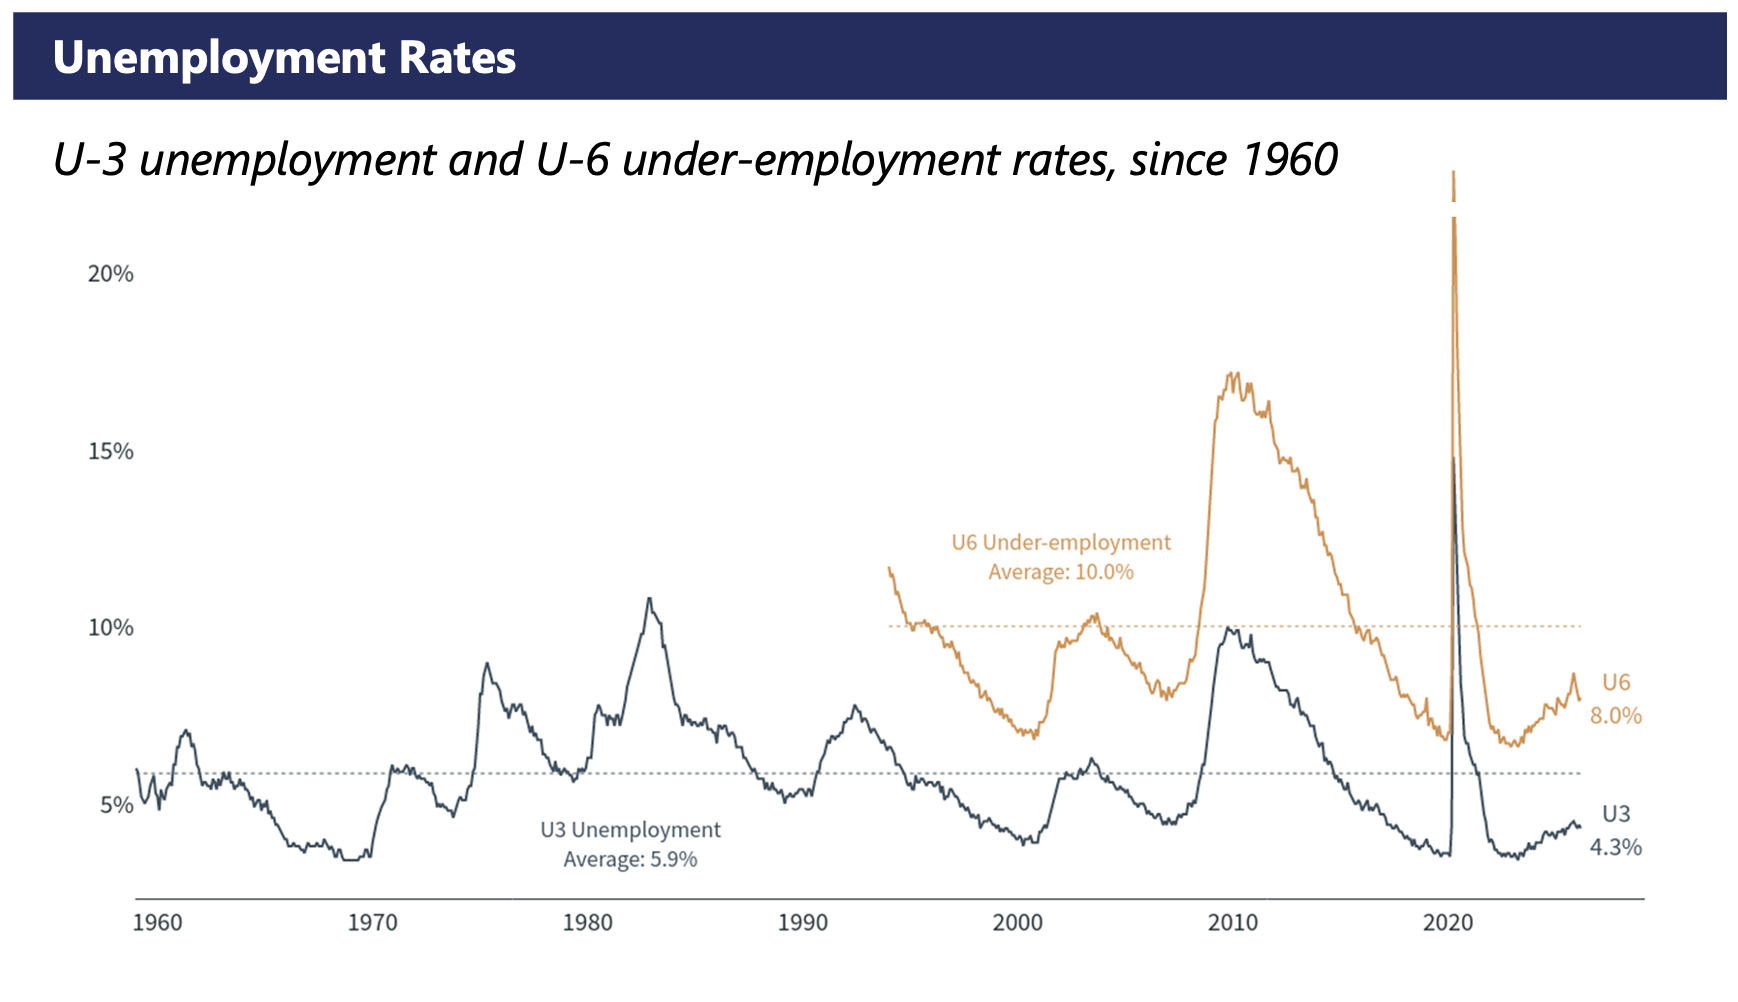
- Unemployment remains below historical norms. This enables the Fed to maintain relatively higher interest rates to combat inflationary pressures.
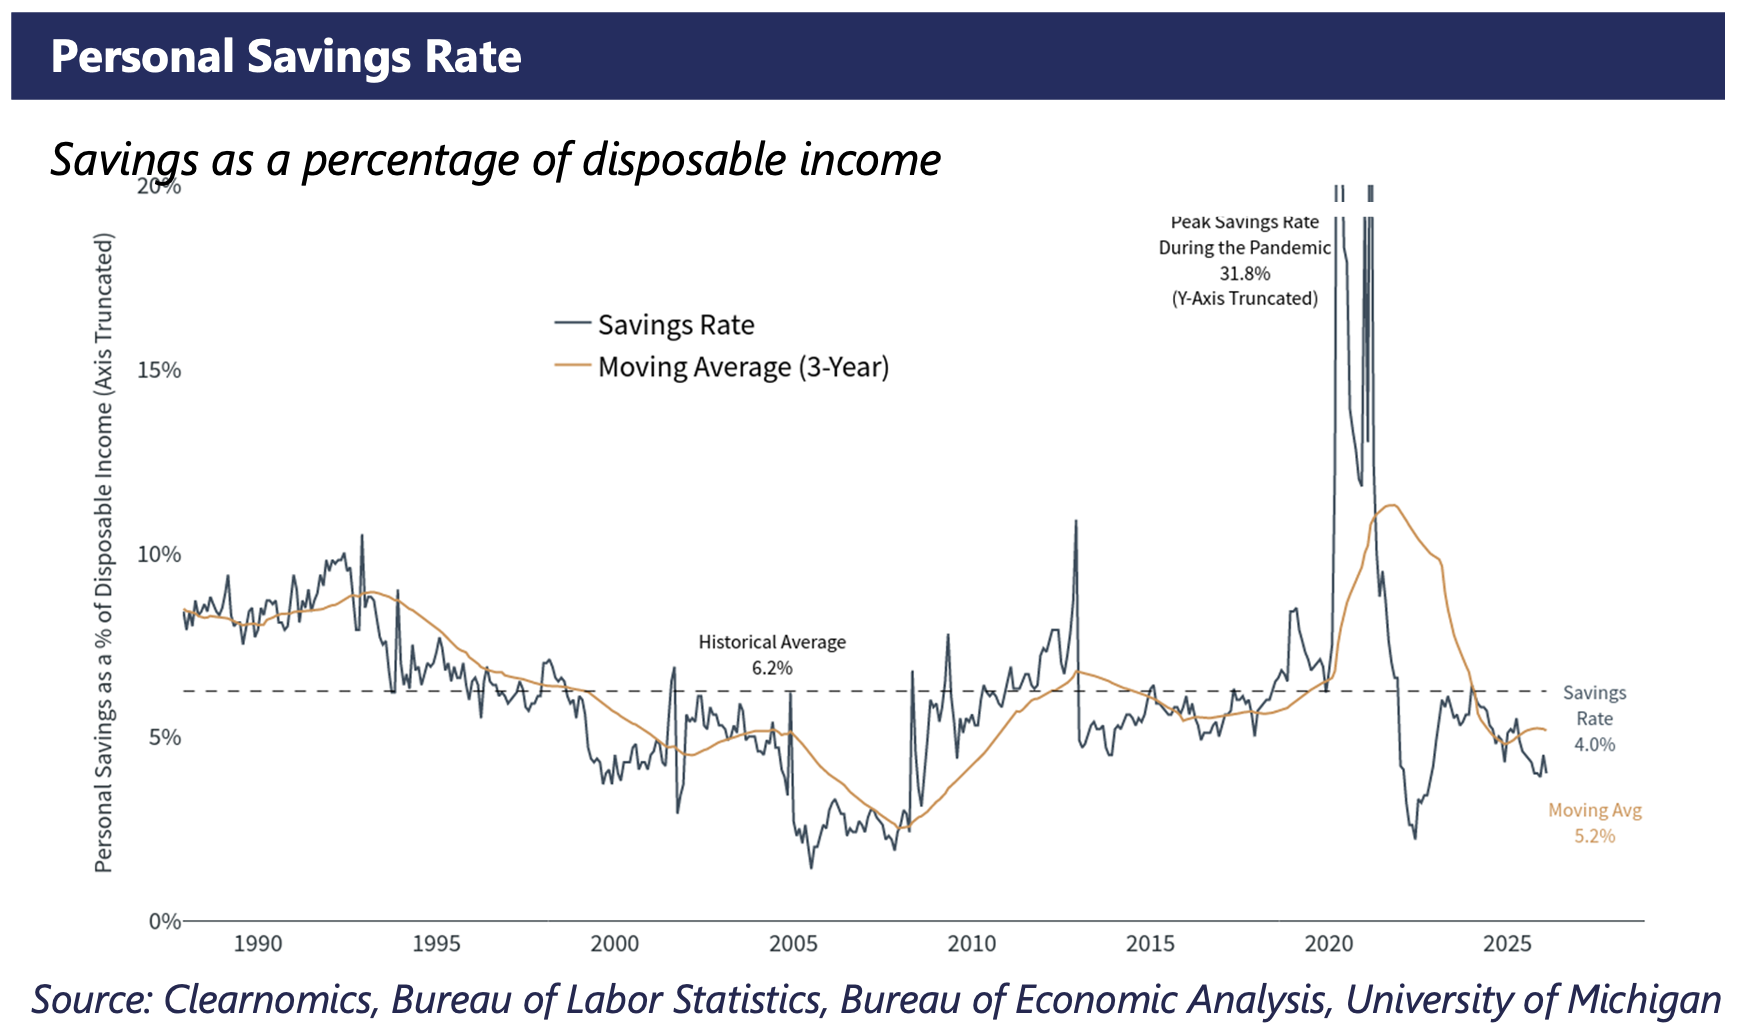
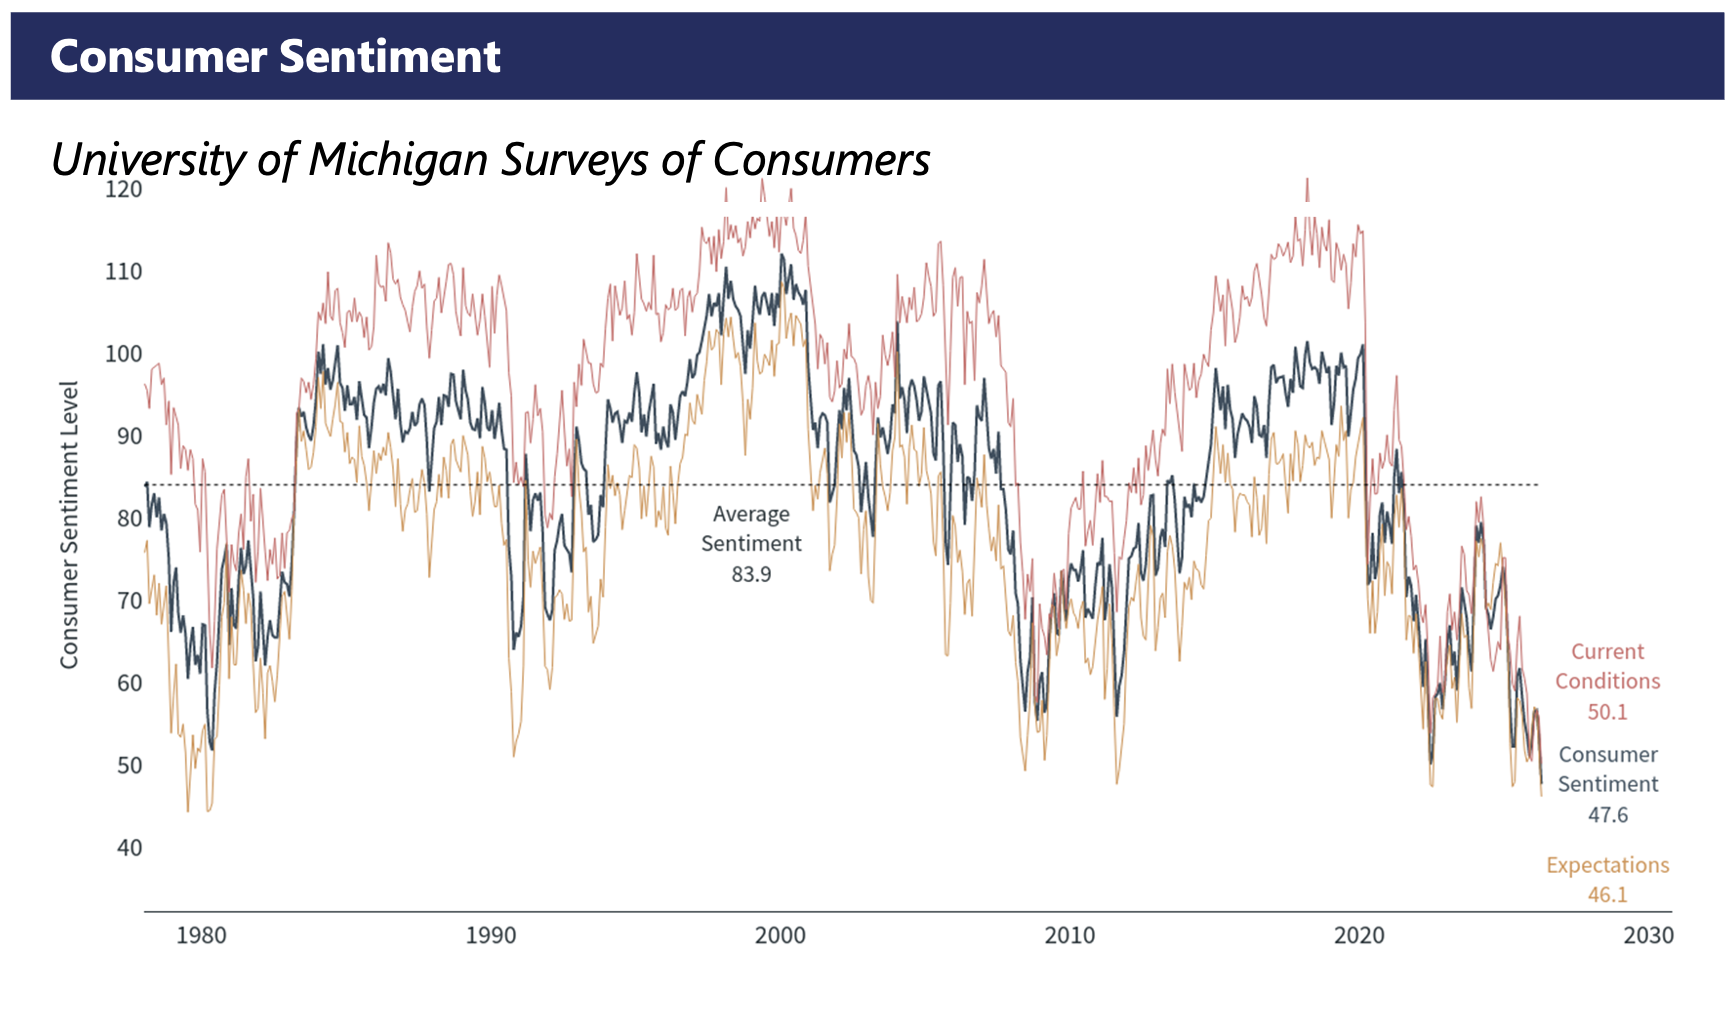
- However, the decline in personal savings rate indicates an elevated level of individual strain occurring in the market. This pressure is reflected in very poor consumer sentiment.
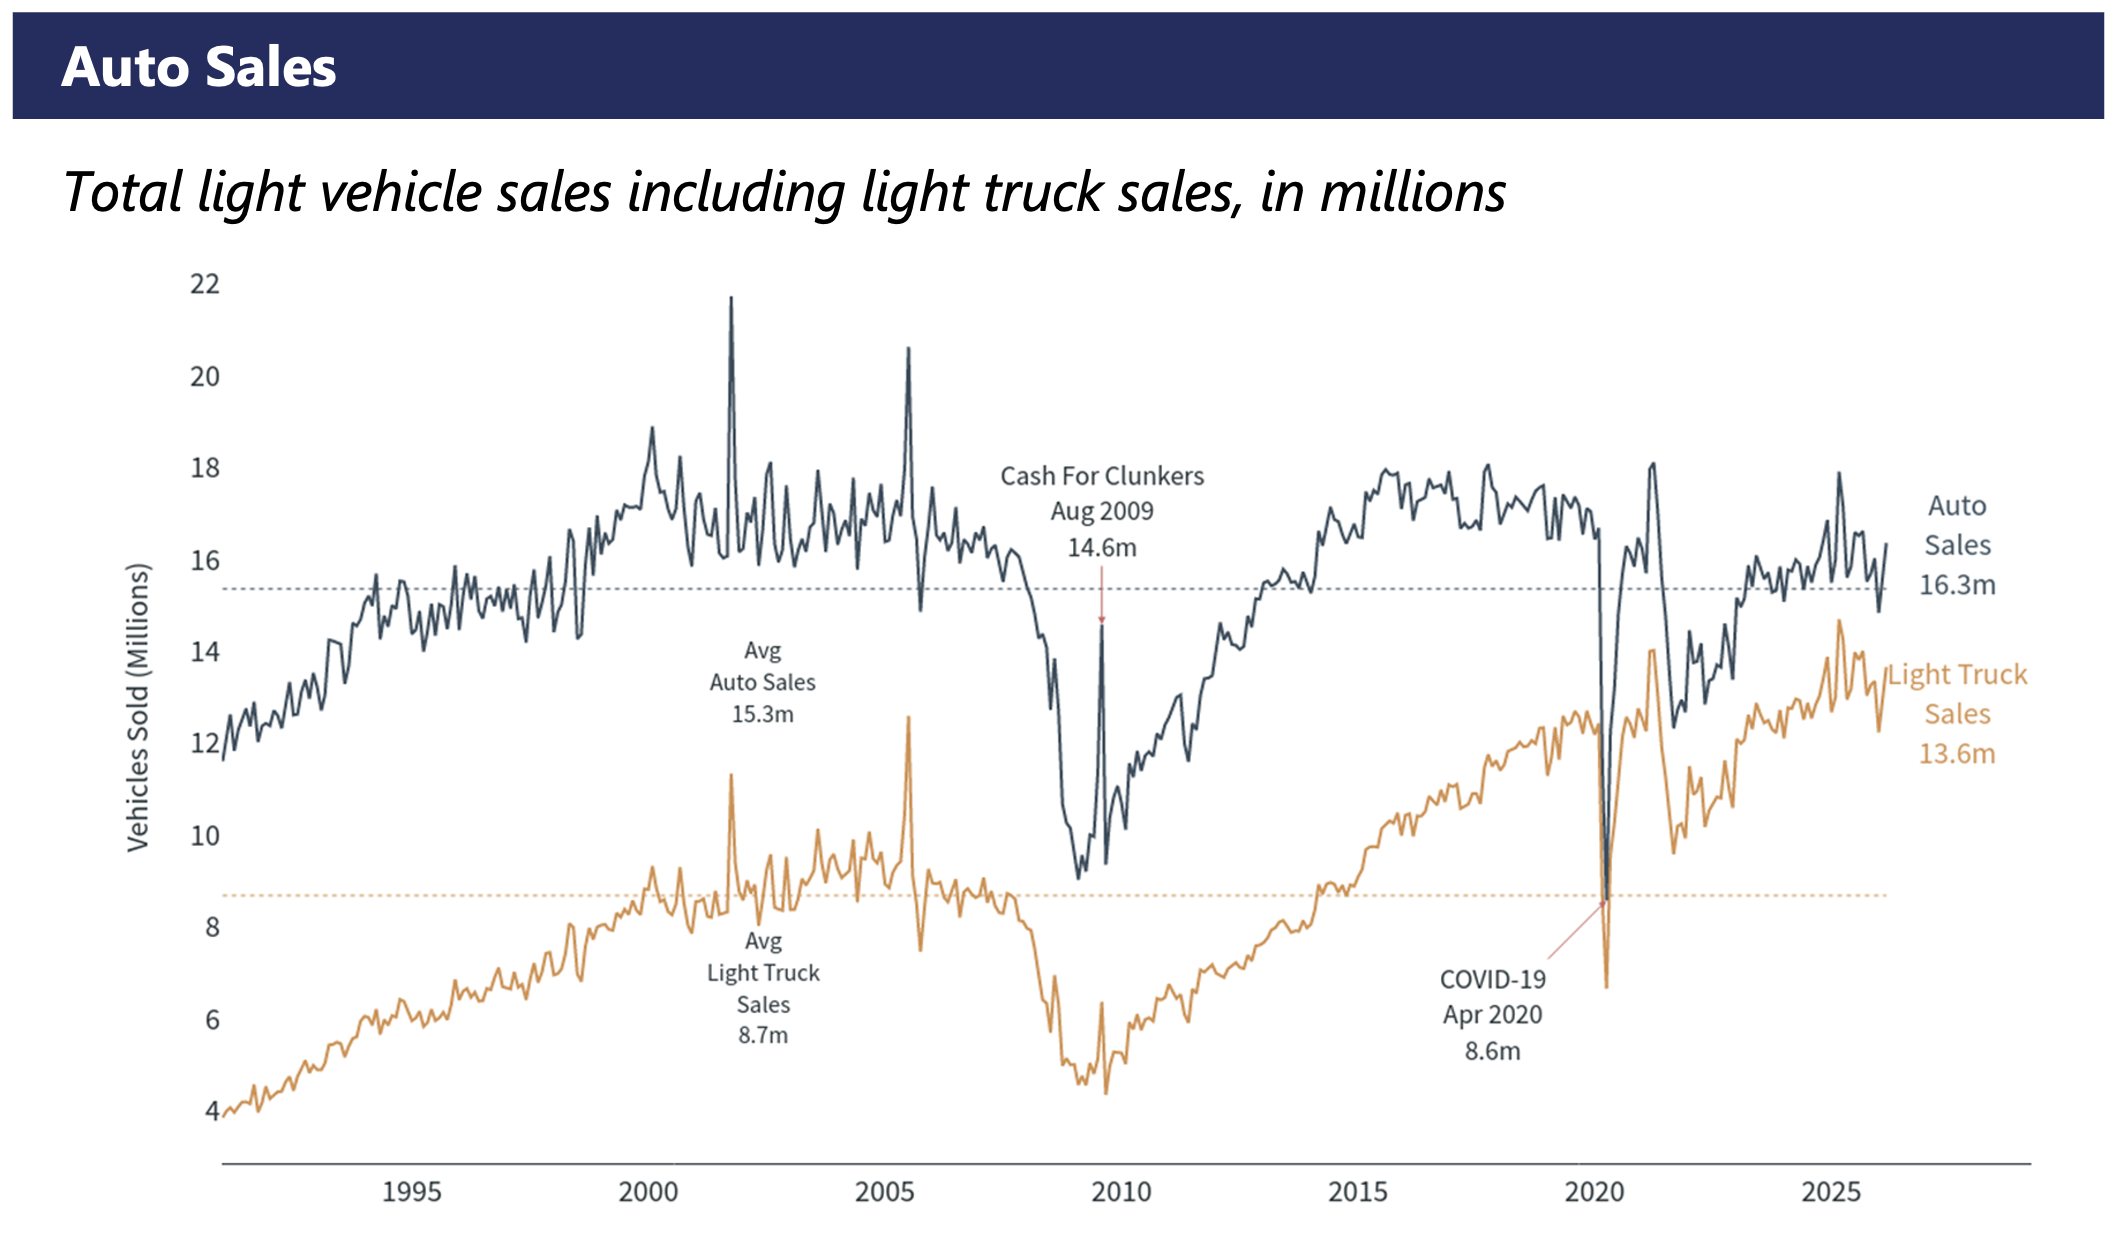
Automotive Impact
- The automotive sector is a bellwether indicator of the health of the consumer, with total light vehicle sales trending around historic.
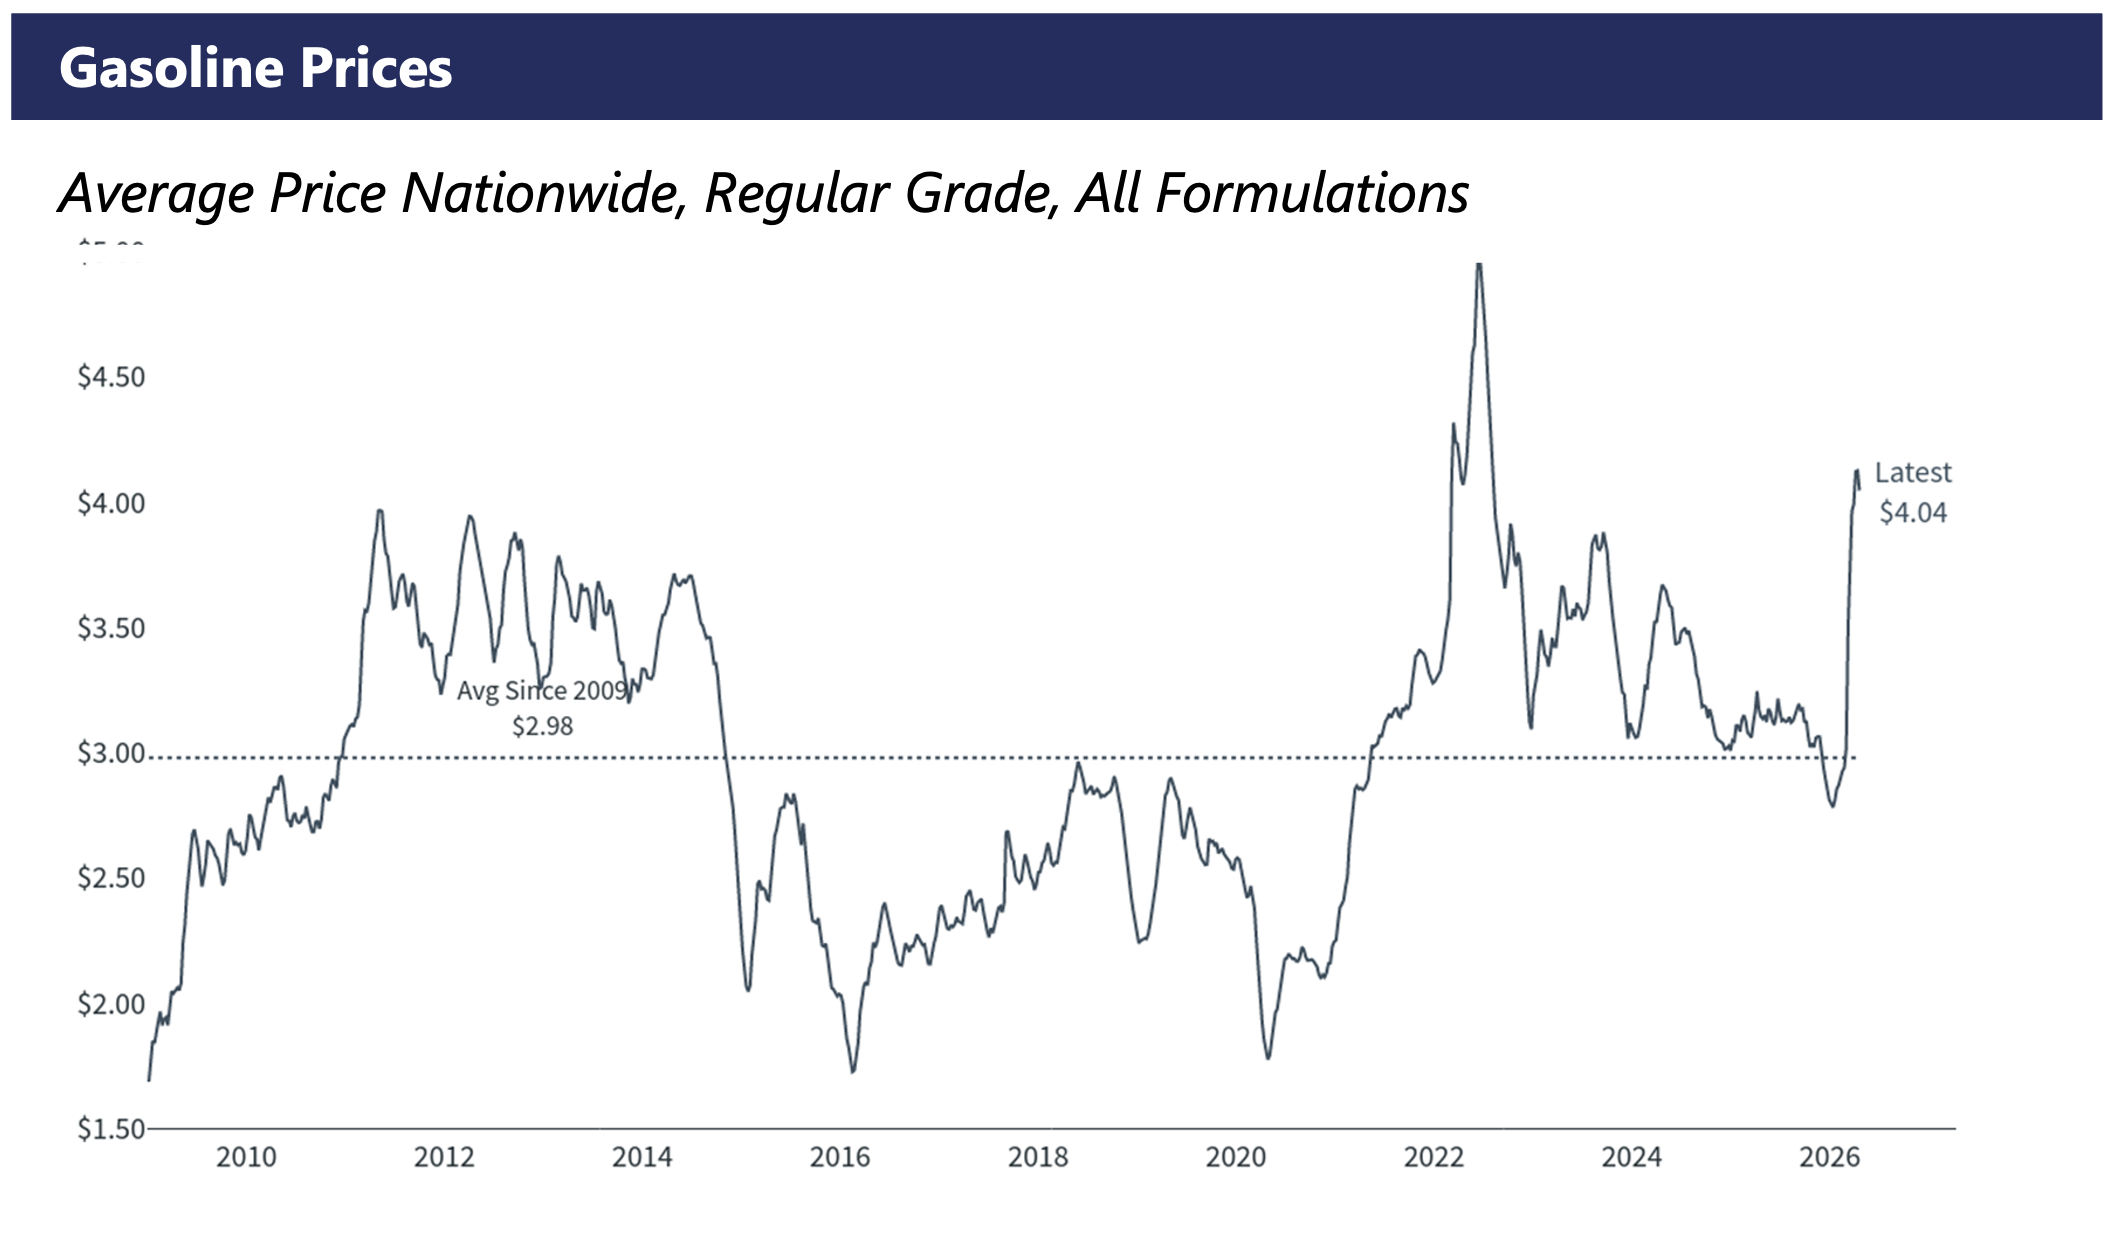
- Rising gas prices typically constrain demand and should be monitored in the upcoming quarters.
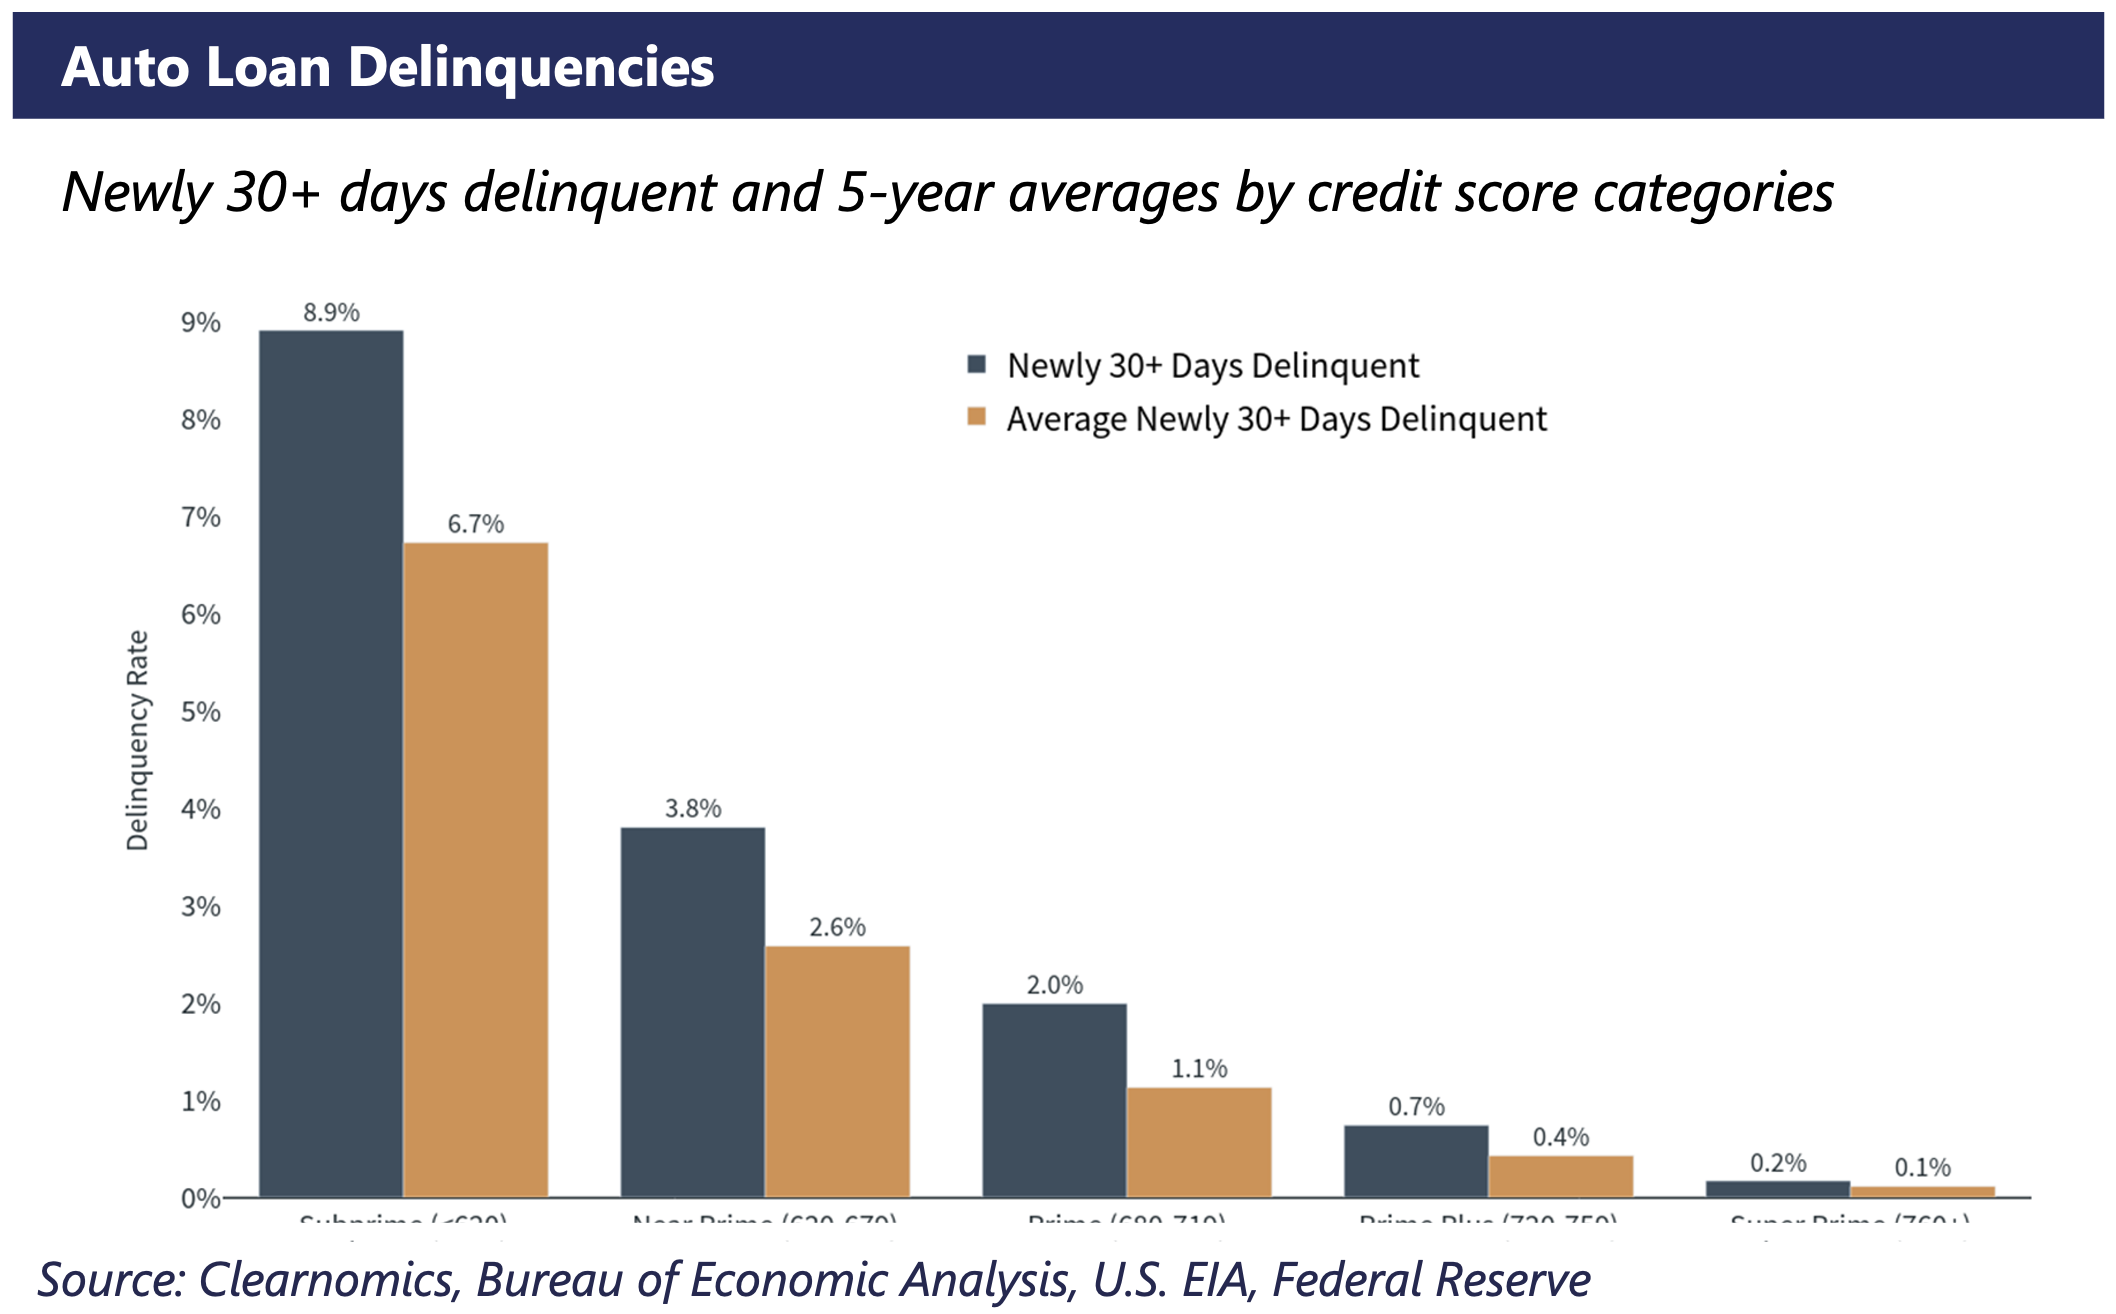
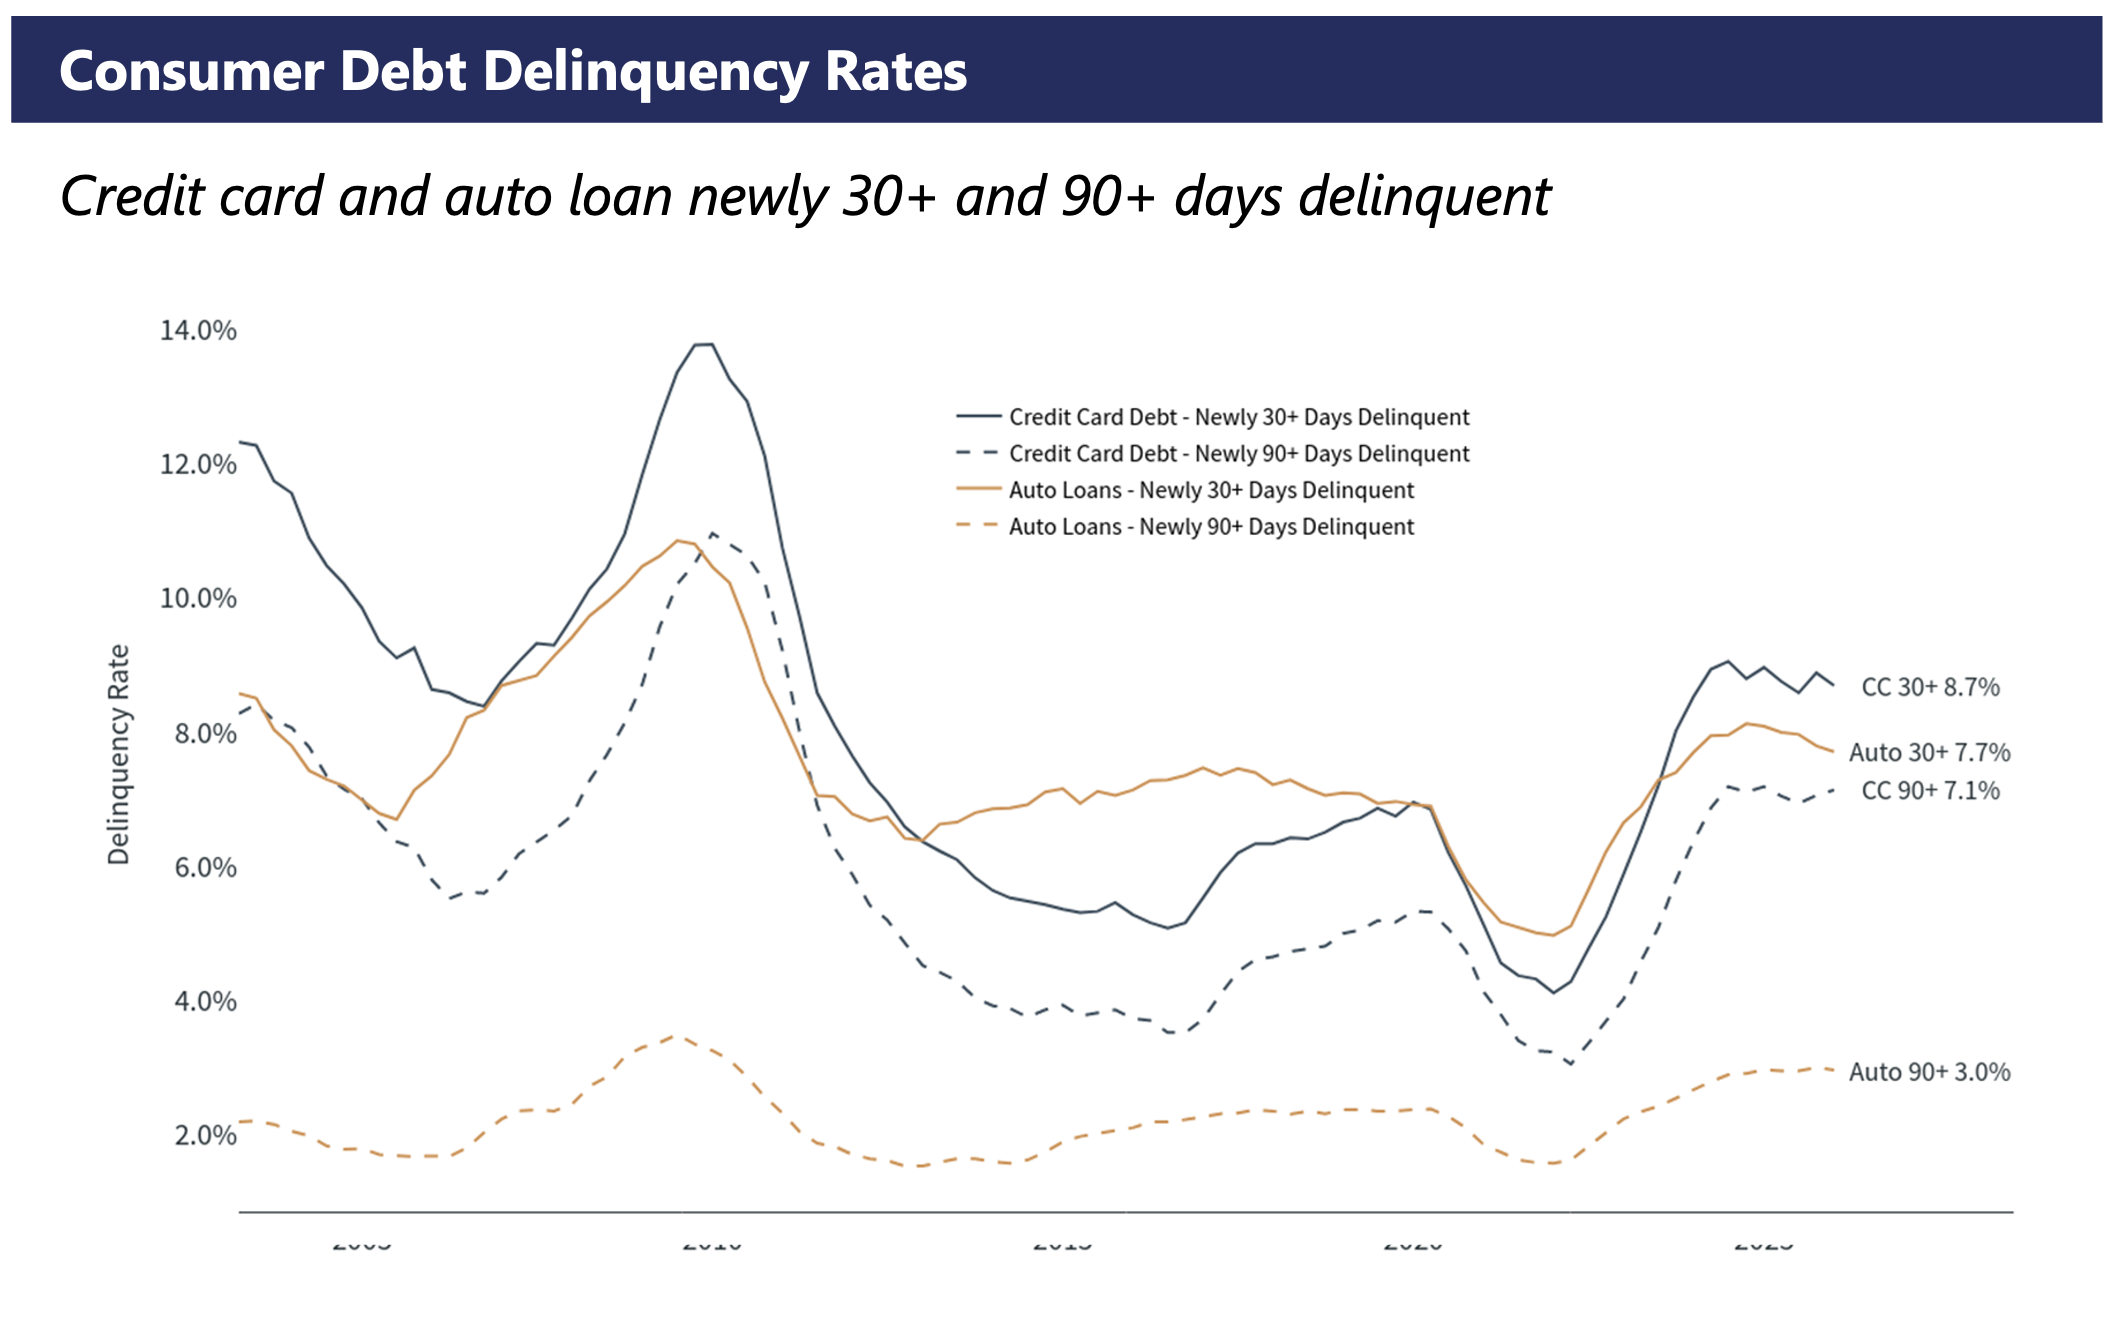
- Increasing delinquency rates reflects the growing pressure on consumers and are aligned with general consumer delinquency trends.
Bond Markets
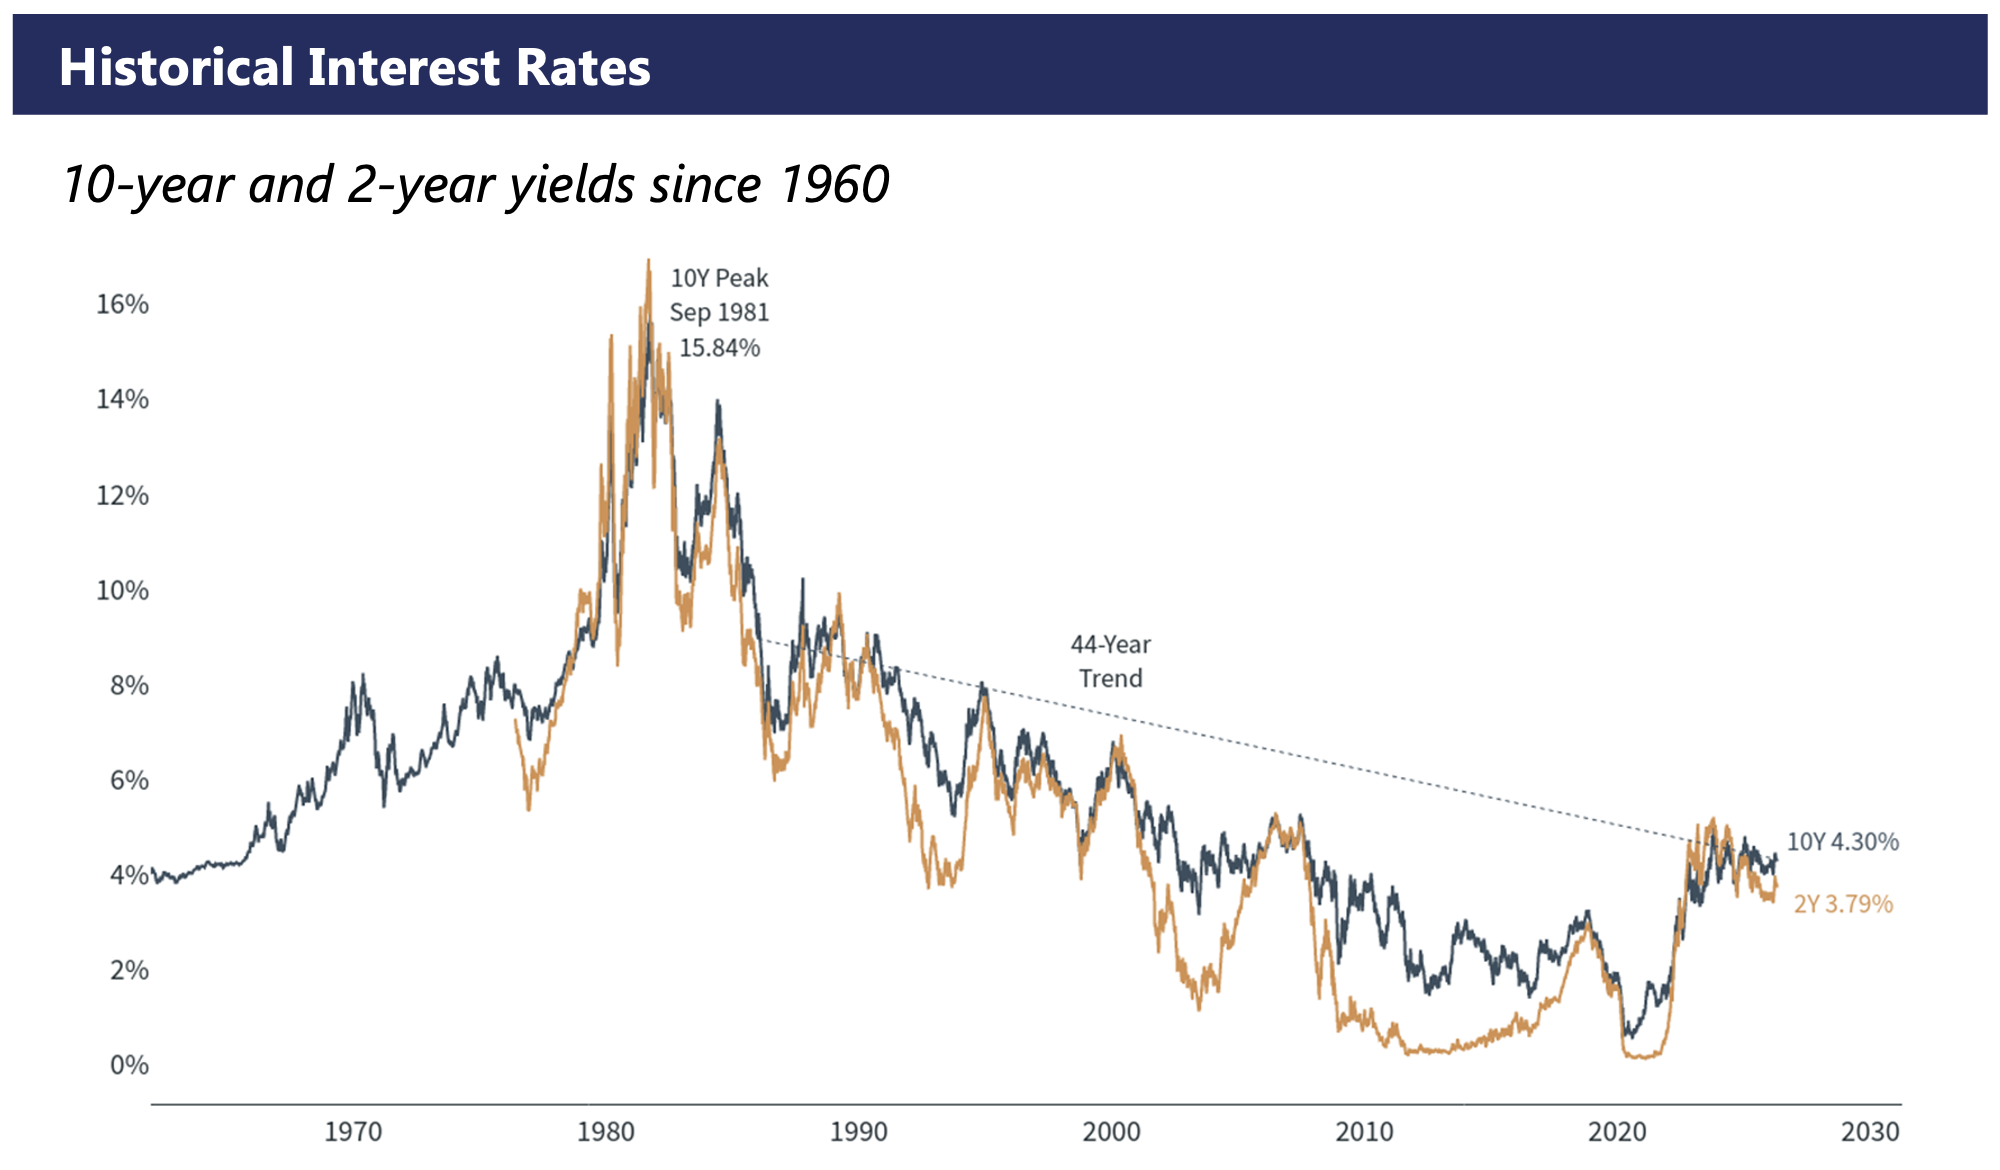
- Interest rates remain elevated since the 2000s. The consumer wants a rate reduction, but rates are in line with historic norms.
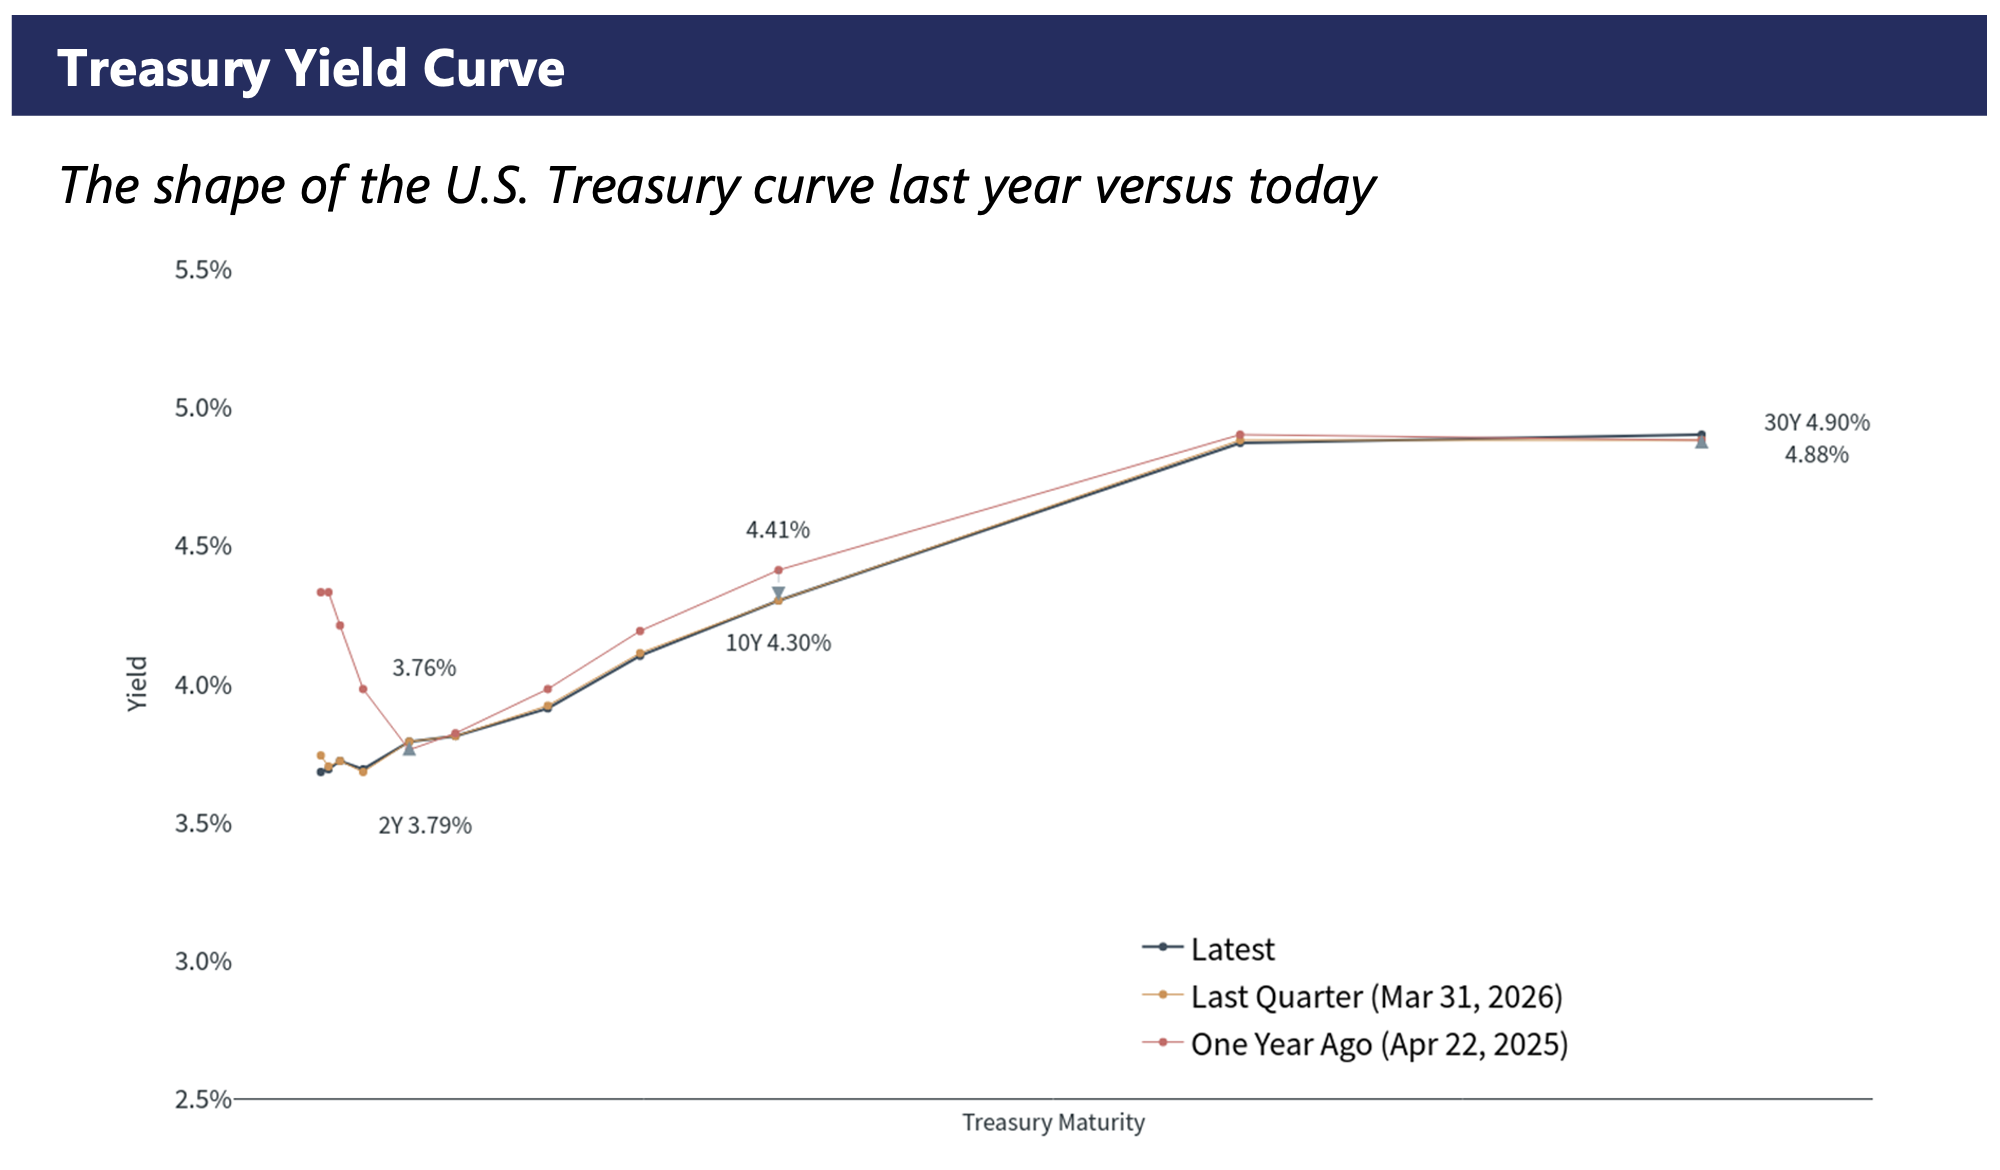
- The treasury yield curve has steepened to a more typical upward slope. However, there remains only modest value in near-term vs. short-term yields.
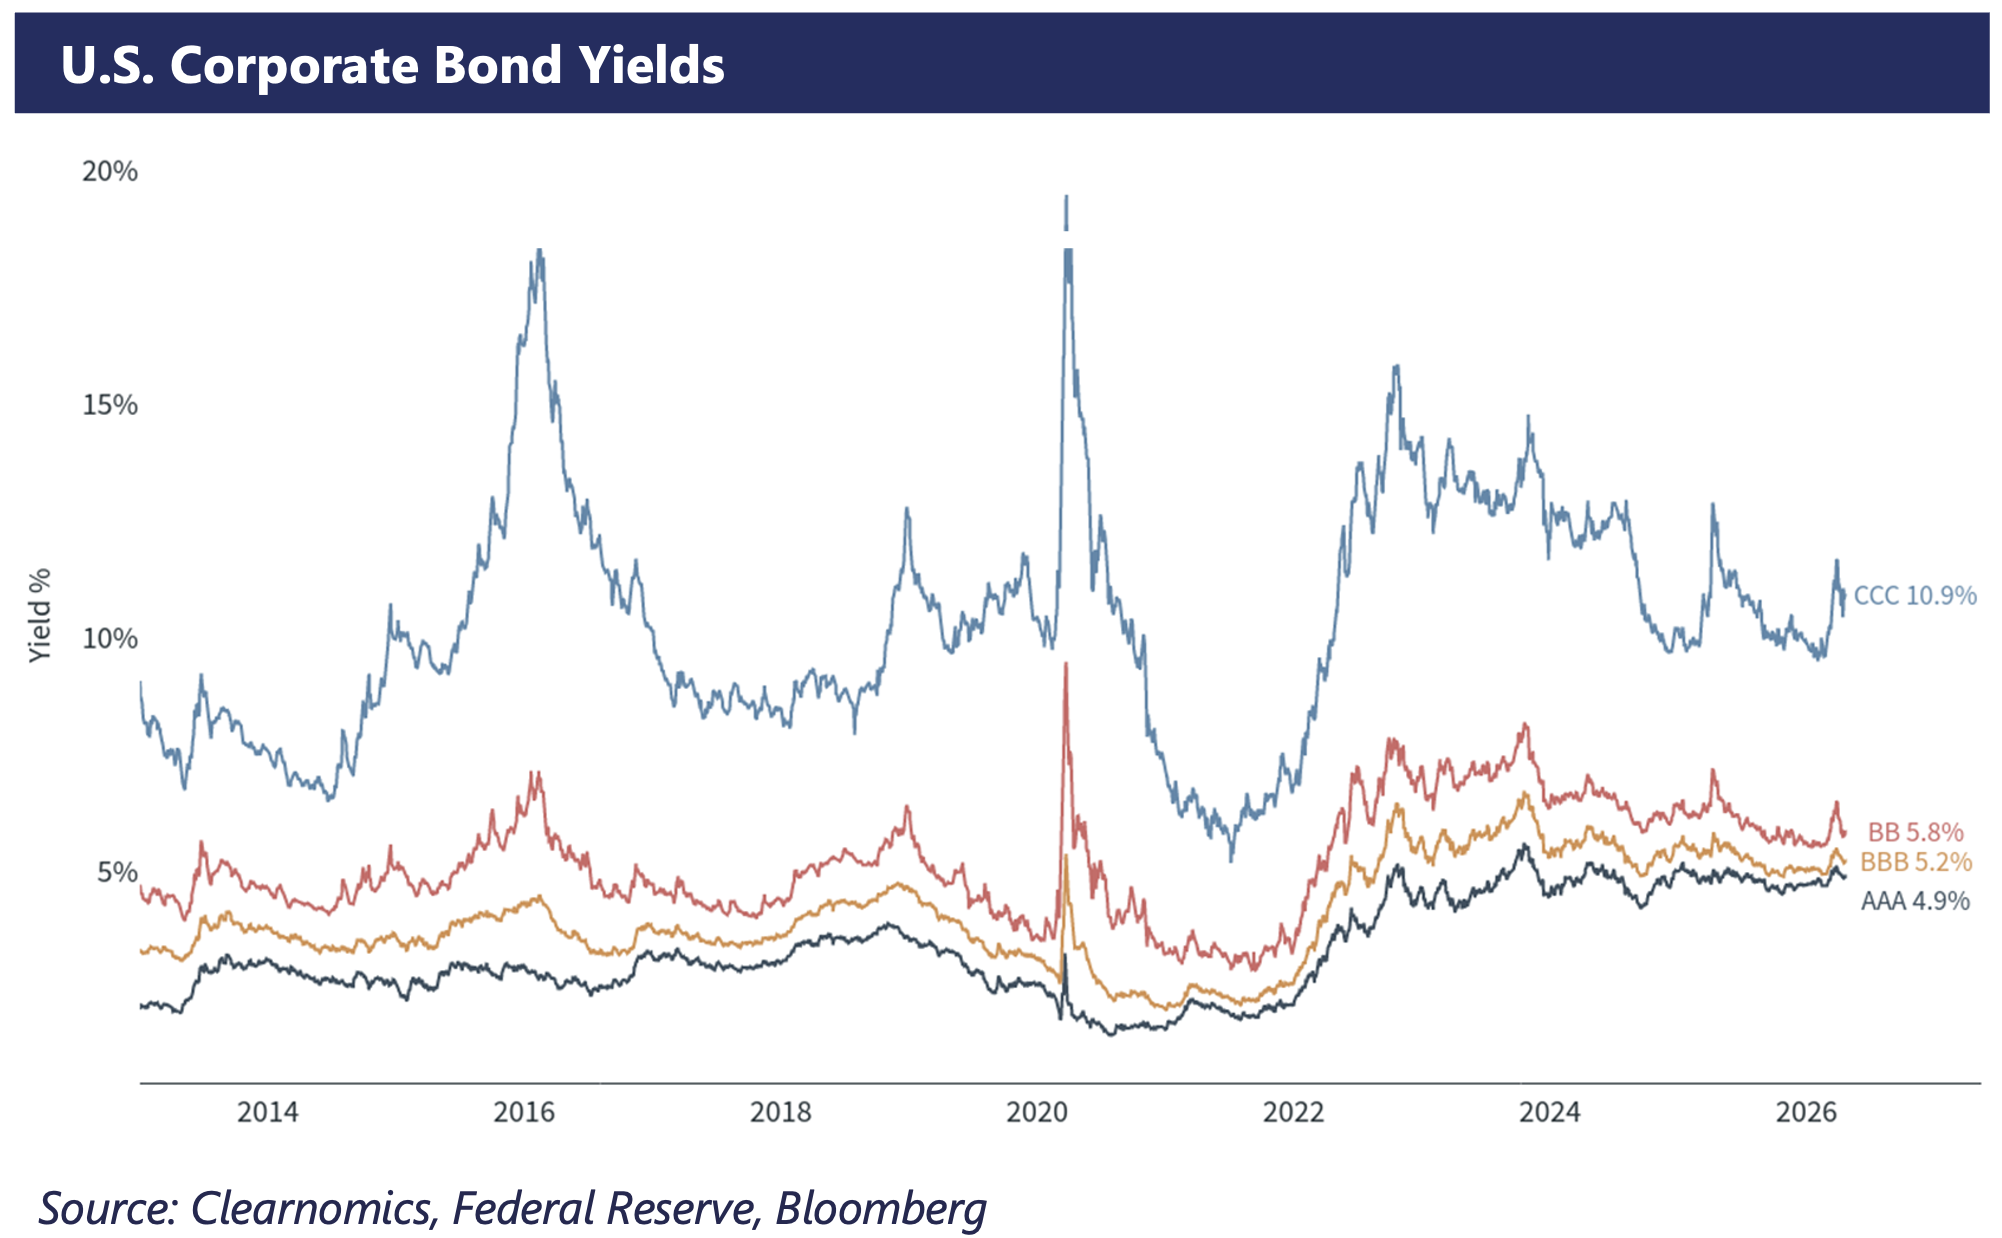
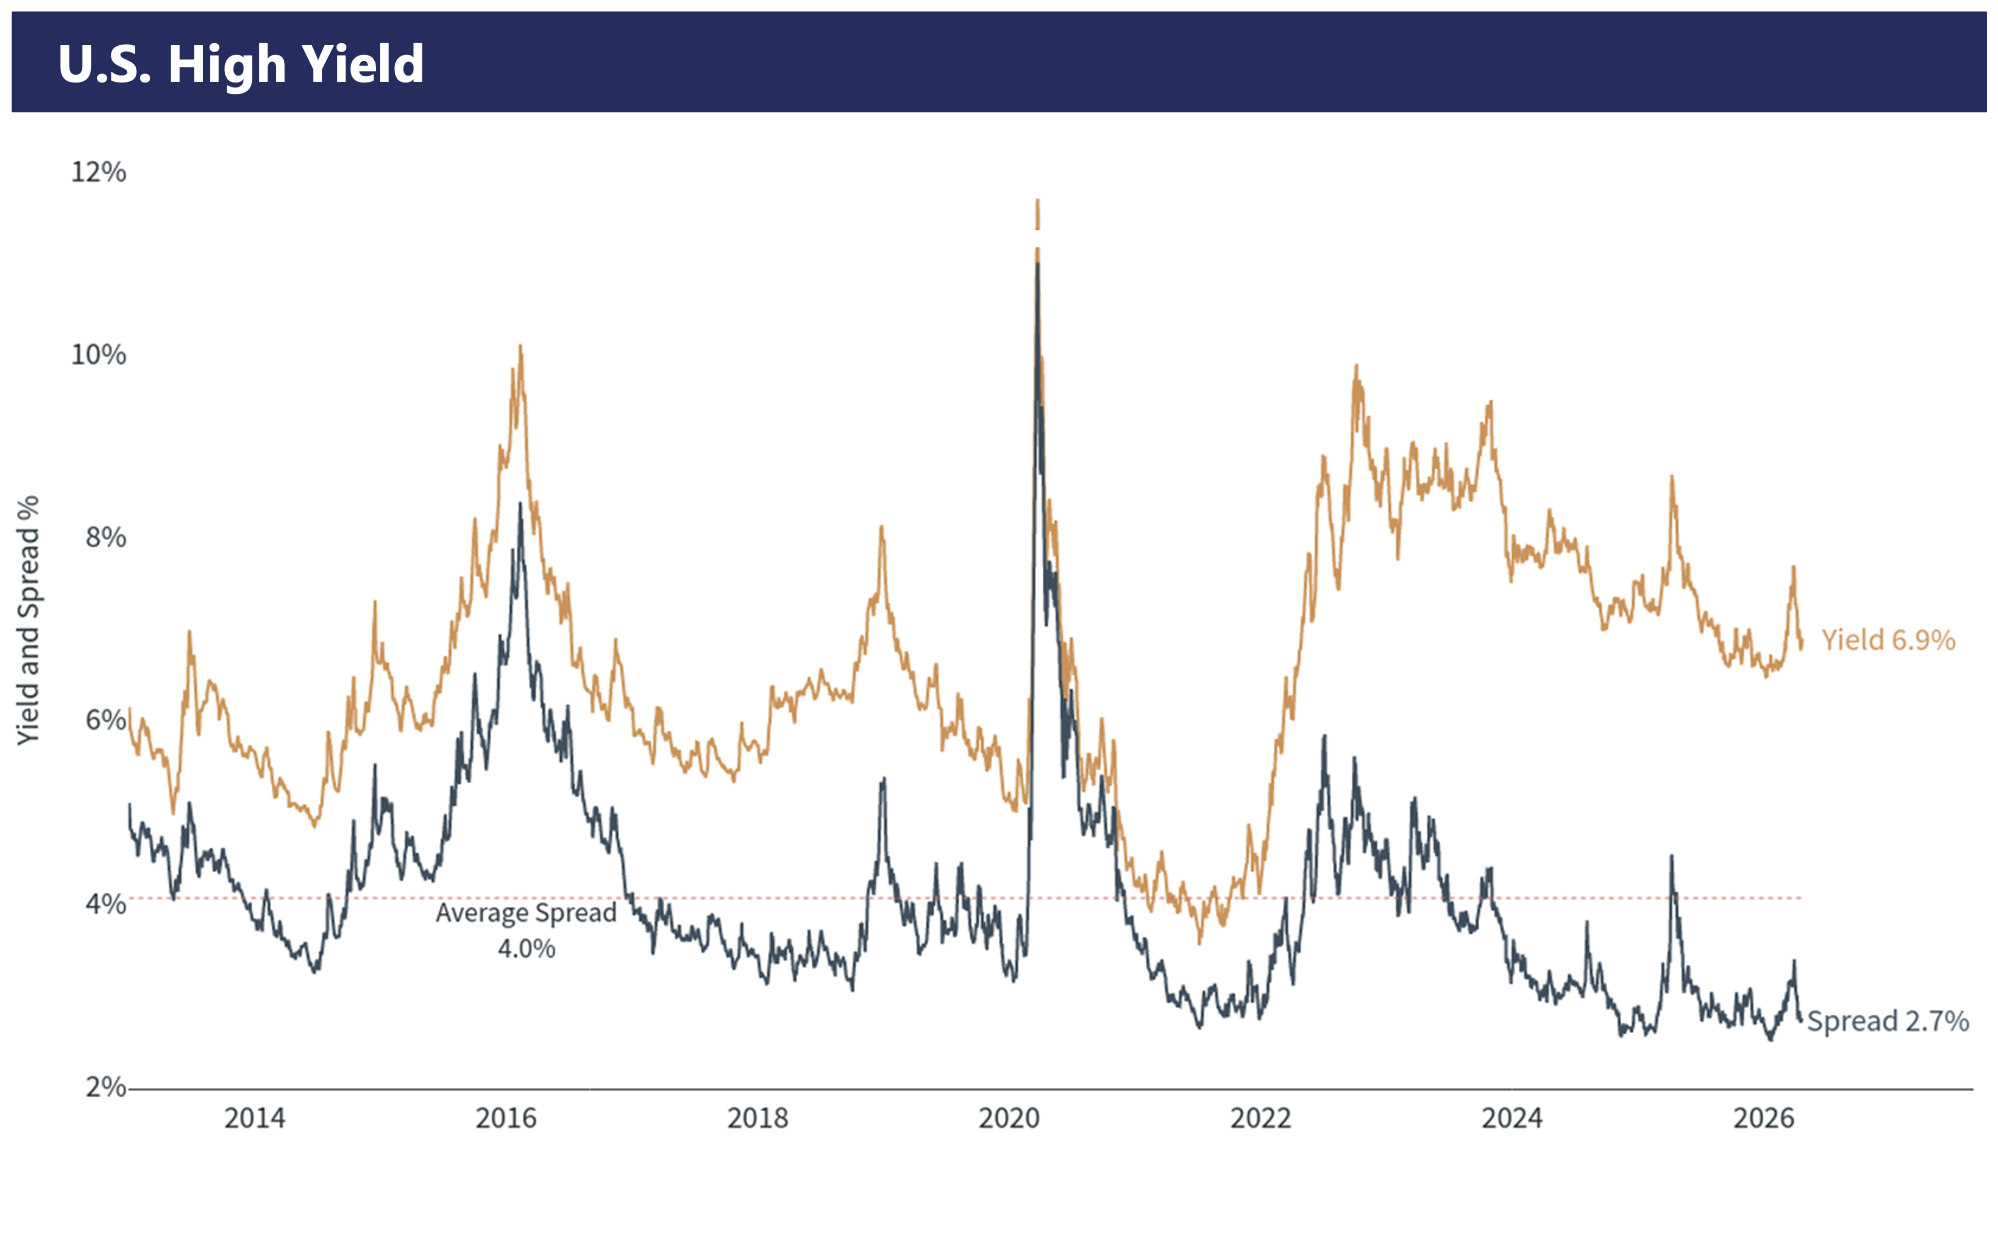
- Corporate spreads remain very tight, reflecting minimal reward for incremental risk vs. Treasuries. This reflects market complacency around recessionary/disruption risk.
Equity Markets
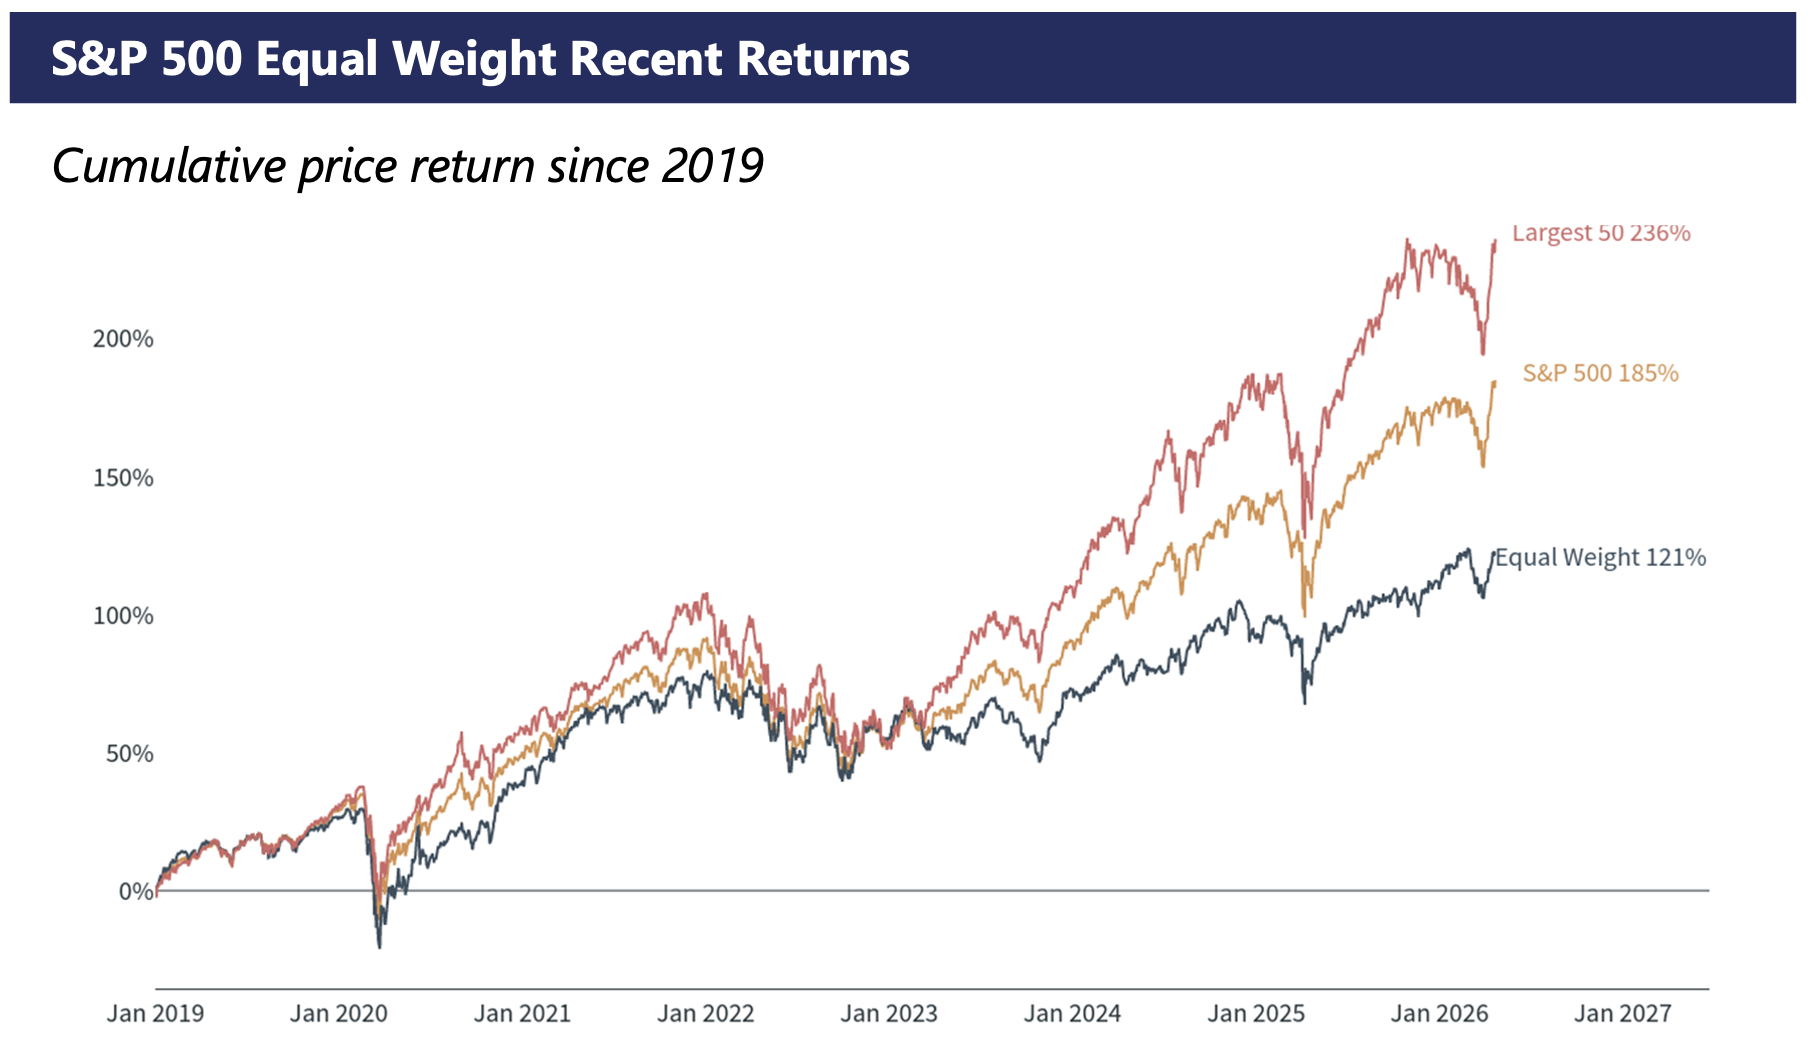
- Equity markets have continued to show incredible resilience, powered by mega cap names in the U.S. Complacency in bond spreads are reflected in strong equity valuations.
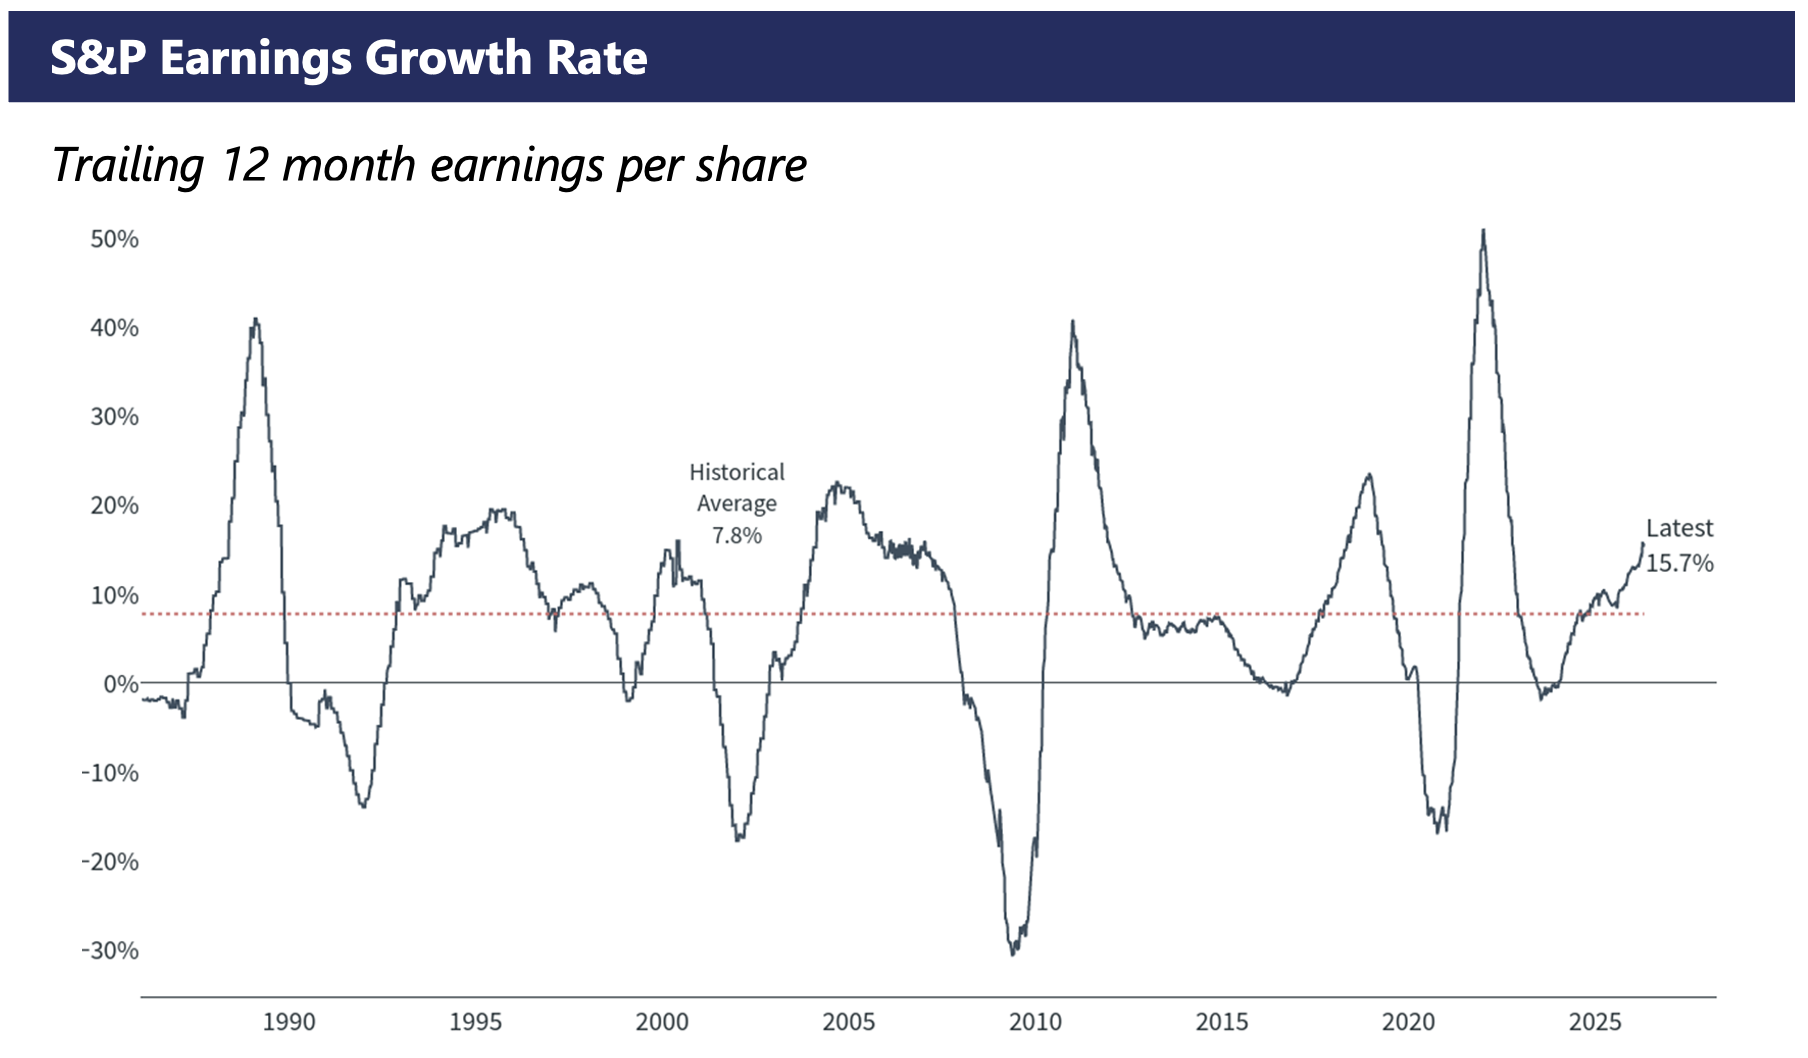
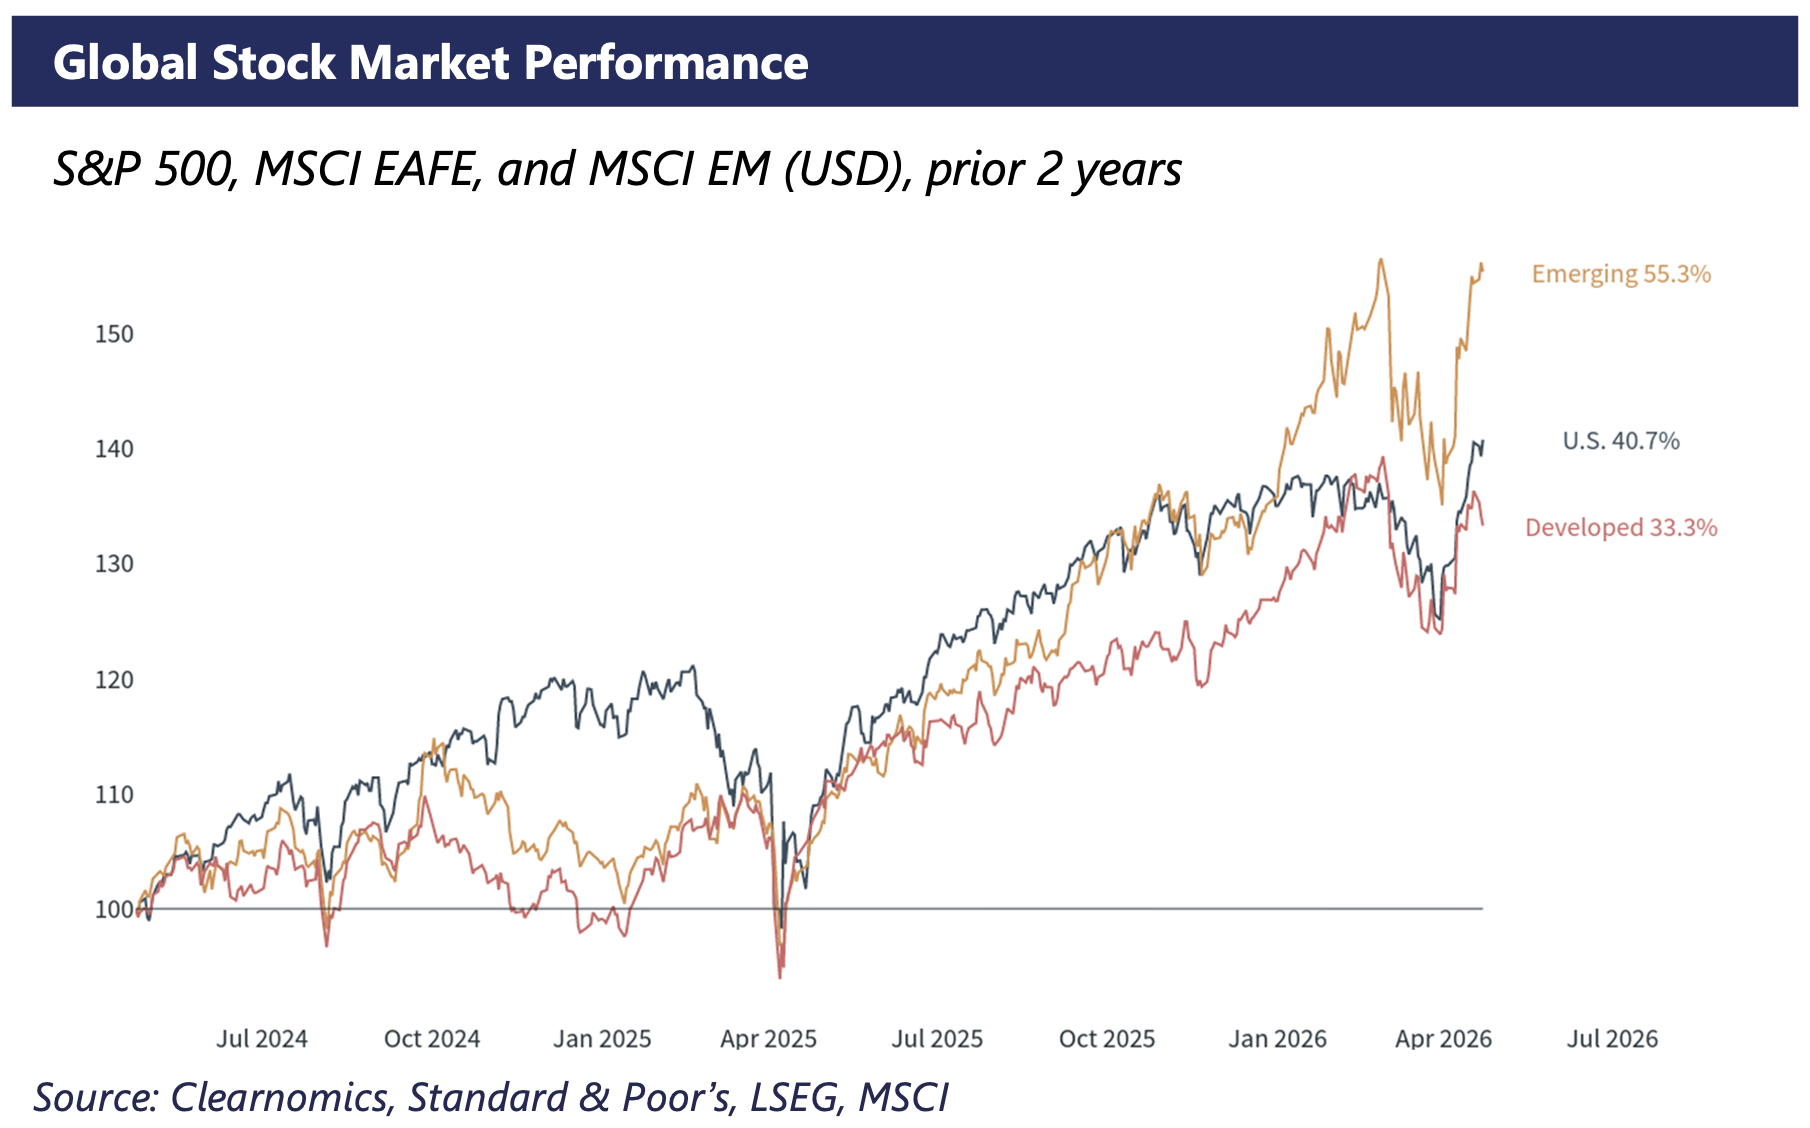
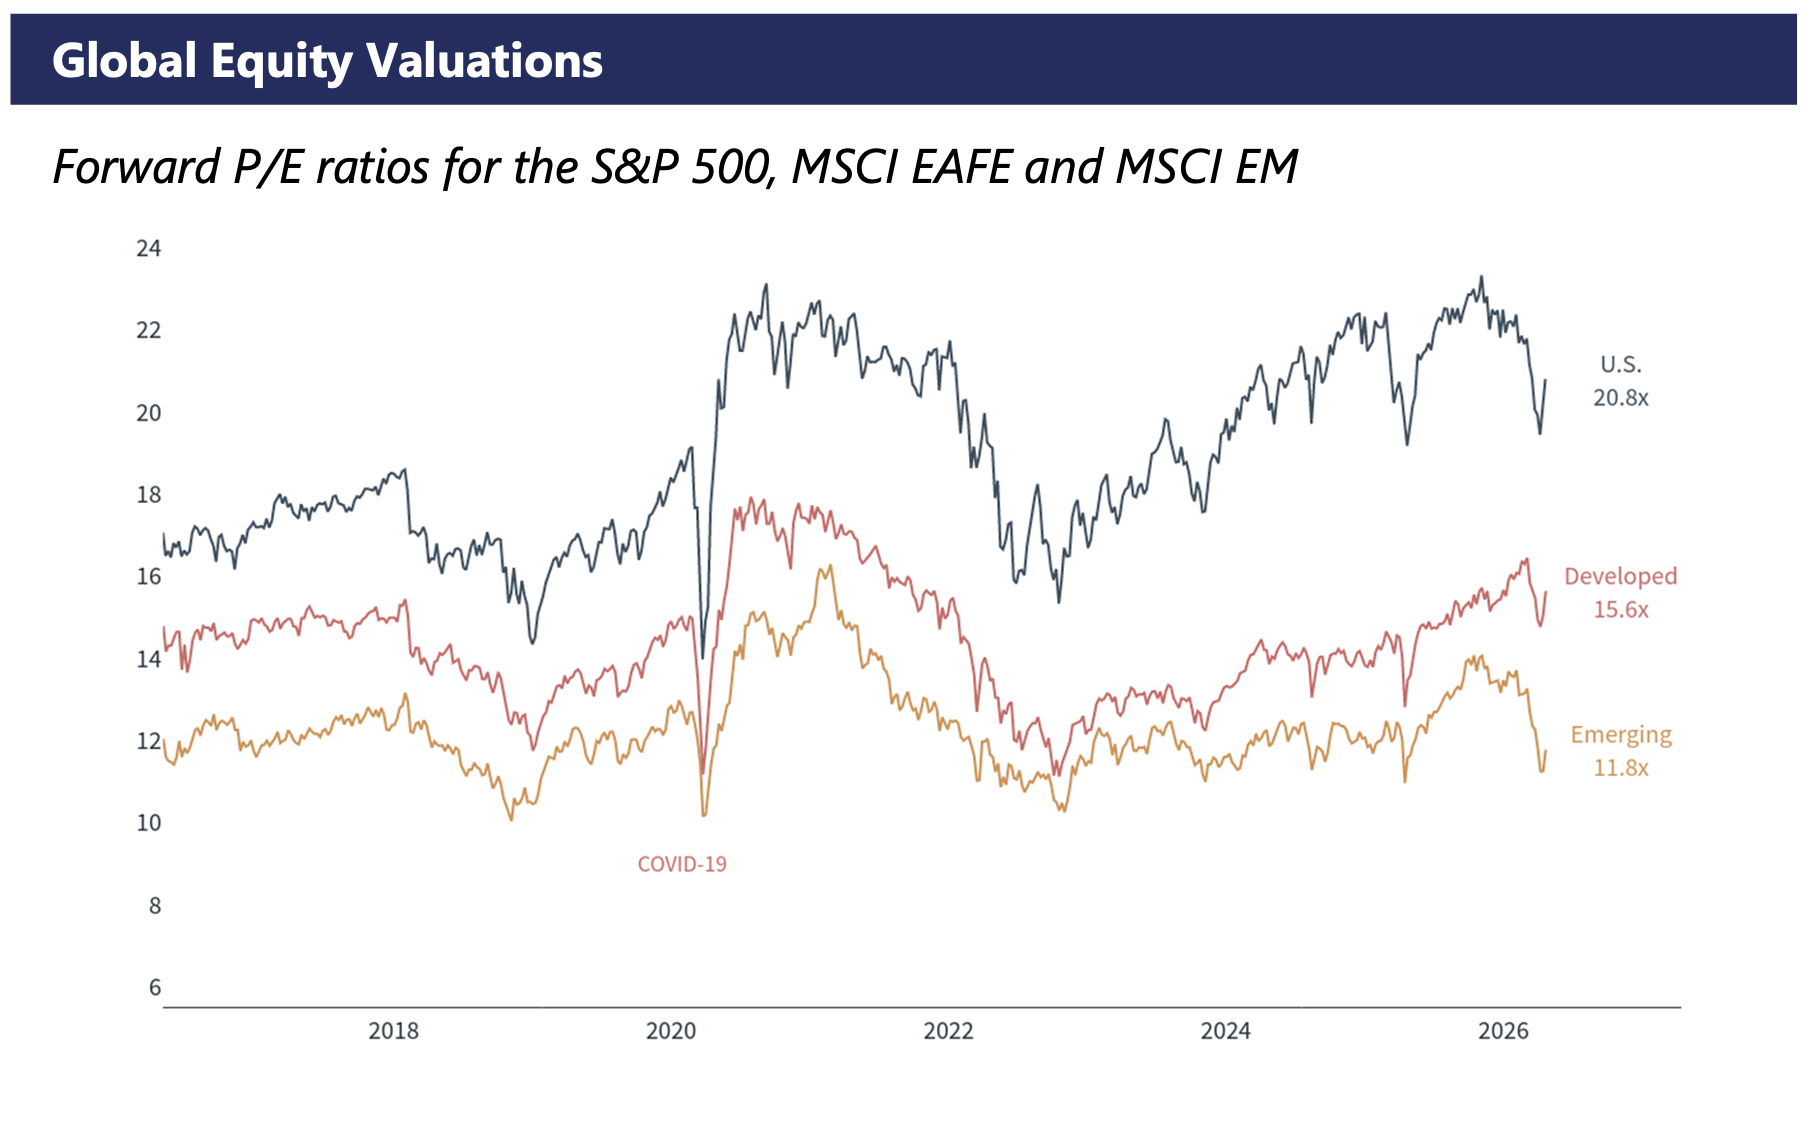
- Emerging and Developed markets trade at discounts to the U.S. but also lack the quality businesses such as Alphabet and Microsoft that have powered U.S. earnings growth.
- WMK continues to believe that over the long-term, equities will generate an outsized proportion of returns to the patient investor who can weather volatility.
Asset Class Performance
Total returns and annual averages over the period shown
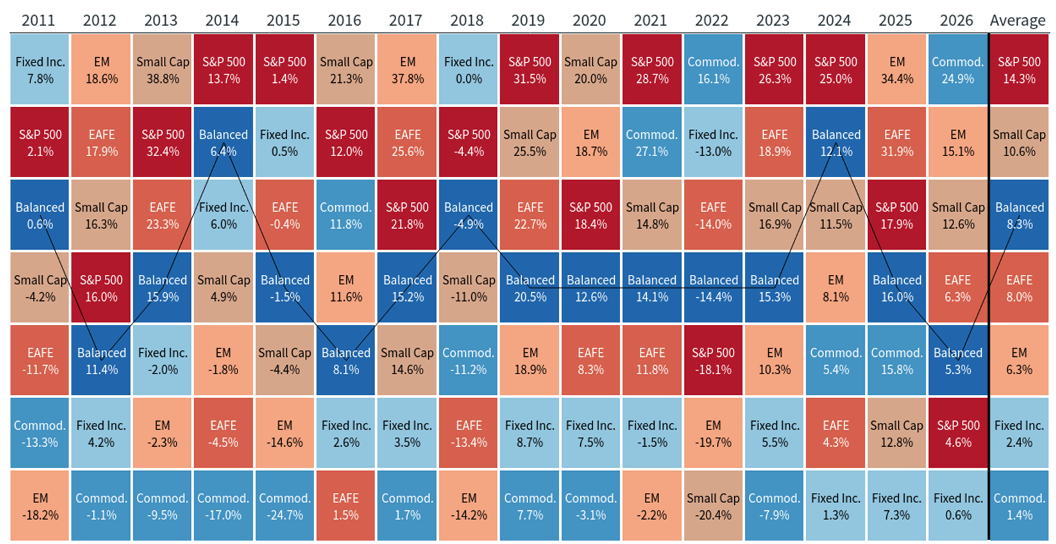
The Balanced Portfolio is a 60/40 historical index calculation consisting of 40% U.S. Large Cap, 5% Small Cal, 10% International Developed Equities, 5% Emerging Market Equities, 35% U.S. Bonds, and 5% Commodities.
Source: Clearnomics, LSEG
Definitions
The S&P 500 is a market capitalization-weighted index of large cap U.S. stocks. U.S. mid cap and small cap are the S&P 400 and S&P 600, respectively. Value and growth are the corresponding Standard & Poor’s value and growth indices.
MSCI EM is an index of emerging market stocks. MSCI EAFE is an index of developed market stocks. MSCI ACWI is an index of global stocks.
The forward P/E is a ratio of the current market price of an index divided by an estimate of earnings over the next twelve months. The Shiller P/E is based on Robert Shiller’s cyclically adjusted price-to-earnings ratio.
The AAII Investor Sentiment index is based on a weekly survey conducted by AAII.
Unless stated otherwise, earnings and valuations data are from LSEG indices.
The LEI, or Leading Economic Index, is produced monthly by the Conference Board.
Consumer sentiment indices are based on surveys conducted by the University of Michigan Surveys of Consumers.
Asset Class Performance and Asset Classes Relative to U.S. Stocks charts: The EM, EAFE, Small Cap, Fixed Income and Commodities are these indices, respectively: MSCI EM, MSCI EAFE, Russell 2000, Bloomberg U.S. Aggregate Bond Index, Bloomberg Commodity Index.
Fixed Income Performance: All sectors are represented by the Bloomberg bond indices except for EMD USD and Local which are the JPMorgan EMBIG Diversified Index and JPMorgan GBI-EM Core Index, respectively.
The Balanced Portfolio is a historical 60/40 index calculation consisting of 40% U.S. Large Cap, 5% Small Cap, 10% International Developed Equities, 5% Emerging Market Equities, 35% U.S. Bonds, and 5% Commodities.
The Bloomberg Commodity Index is a broadly diversified basket of physical commodities futures contracts.
The DXY is a U.S. dollar index based on a basket of currencies, including the Euro, Yen, Pound, Canadian Dollar, Swedish Krona and Swiss Franc.
Portfolio Risk/Reward and Portfolio Drift Since 2009 charts: stocks and bonds are the S&P 500 and Bloomberg U.S. Aggregate bond index, respectively. Each portfolio represents a historical stock/bond asset allocation.
The MSCI Factor indices are created and maintained by MSCI to capture factor returns. They cover various factors including Quality, Size, Momentum, Volatility, Value and Yield. The Multi-Factor index tracks the performance of Value, Momentum, Quality and Size.
The MSCI USA index tracks large and mid cap U.S. stocks.
Disclosures
WMKI Group, LLC (“WMKI”) dba WMK Investment Partners is an SEC registered investment adviser located in Colorado.
This presentation is limited to the dissemination of general information regarding WMKI’s investment advisory services. Accordingly, the information in this presentation should not be construed, in any manner whatsoever, as a substitute for personalized individual advice from WMKI. Information presented is for educational purposes only and does not intend to make an offer or solicitation for the sale or purchase of any specific securities, investments, or investment strategies. Investments involve risk and unless otherwise stated, are not guaranteed. Be sure to first consult with a qualified financial adviser and/or tax professional before implementing any strategy discussed herein. Any client examples are hypothetical and used to demonstrate a concept.
Past performance is not indicative of future performance. Therefore, no current or prospective client should assume that future performance of any specific investment, investment strategy (including the investments and/or investment strategies recommended by WMKI), or product referenced directly or indirectly in this presentation, will be profitable. Different types of investments involve varying degrees of risk, and there can be no assurance that any specific investment or investment strategy will be suitable for a client’s or prospective client’s investment portfolio.
Various indexes were chosen that are generally recognized as indicators or representation of the stock market in general. Indices are typically not available for direct investment, are unmanaged and do not include fees or expenses. Some indices may also not reflect reinvestment of dividends.
Clearnomics Disclosures
Copyright (c) 2026 Clearnomics, Inc. All rights reserved. The information contained herein has been obtained from sources believed to be reliable, but is not necessarily complete and its accuracy cannot be guaranteed. No representation or warranty, express or implied, is made as to the fairness, accuracy, completeness, or correctness of the information and opinions contained herein. The views and the other information provided are subject to change without notice. All reports posted on or via www.clearnomics.com or any affiliated websites, applications, or services are issued without regard to the specific investment objectives, financial situation, or particular needs of any specific recipient and are not to be construed as a solicitation or an offer to buy or sell any securities or related financial instruments. Past performance is not necessarily a guide to future results. Company fundamentals and earnings may be mentioned occasionally, but should not be construed as a recommendation to buy, sell, or hold the company’s stock. Predictions, forecasts, and estimates for any and all markets should not be construed as recommendations to buy, sell, or hold any security–including mutual funds, futures contracts, and exchange traded funds, or any similar instruments. The text, images, and other materials contained or displayed in this report are proprietary to Clearnomics, Inc. and constitute valuable intellectual property. All unauthorized reproduction or other use of material from Clearnomics, Inc. shall be deemed willful infringement(s) of this copyright and other proprietary and intellectual property rights, including but not limited to, rights of privacy. Clearnomics, Inc. expressly reserves all rights in connection with its intellectual property, including without limitation the right to block the transfer of its products and services and/or to track usage thereof, through electronic tracking technology, and all other lawful means, now known or hereafter devised. Clearnomics, Inc. reserves the right, without further notice, to pursue to the fullest extent allowed by the law any and all criminal and civil remedies for the violation of its rights.