
The predominant theme in the markets during the third quarter of 2026 was rapidly rising interest rates. The 10-year Treasury yield climbed from 4.4% at the end of Q2 to 5.3% at the end of Q3.
The ripple effects of higher rates are widespread:
- Fixed income instruments are worth less now than at the start of the year. This is the most direct consequence of rising rates, and it was evident in the AGG bond index, which represents U.S. investment grade bonds. The AGG fell 3.4% in the quarter.
- Equities should be worth less. The intrinsic value of a business is the net present value of future cash flows. No one knows future cash flows with certainty; market participants can only estimate them. All else equal, higher interest rates mean higher discount rates, which means the same future cash flow is worth less in today’s dollars.
- All else equal, higher rates also reduce future net free cash flows. Companies must finance their operations at higher cost, and interest expense is a real cash expense.
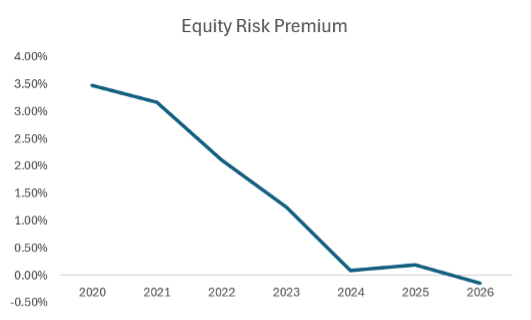
Despite these facts, market cap-weighted indices powered forward in Q3 with the All-Country World Index (ACWI) delivering a 1.7% total return. The driver of continued equity strength is the anticipation for outstanding corporate earnings growth. Consensus estimates call for the S&P 500 companies to grow earnings by a whopping 27% y-o-y in Q3. This level of earnings growth is incredible and theoretically justifies what is now a negative equity risk premium (the forward earnings yield on equities less the 10-year Treasury yield). The more important question is how broad that growth really is.
However, the reality underlying market cap weighted indices paint a different picture. AI infrastructure businesses plus hyperscalers (e.g., Alphabet) are anticipated to contribute 71% of the y-o-y earnings growth. More than 1/3 of the index earnings growth is anticipated to come from just two stocks: Micron and Nvidia, both of which directly relate to AI spend!1
This level of incredible concentration means that while the market hovers near all-time highs, the median stock is 17% below its all-time high.
Accounting flatters this picture. Companies buying AI infrastructure record the spending as capital expenditures, which are capitalized and depreciated over time rather than hitting current earnings. Make no mistake: these costs will eventually show up as expenses. The only question is when, given the wide latitude companies have in setting depreciation schedules for AI capex. Yet the massive capital expenditures show up as earnings for the producers of AI infrastructure (like Micron and Nvidia!).
This dynamic allows index earnings per share to temporarily benefit from both sides of the AI capex transaction. This is powering earnings growth concentration amongst AI linked names.
Further, the return on AI capex remains to be seen. A finance professor at Columbia University estimates that Americans will need to spend nearly 9% of GDP on AI tools by 2032 to generate a 10% unlevered return on capital based on the pace of capital expenditures today. To reach this level, the US would need to double its spending on computers and software, which represents 4.4% of GDP today.2
Strategic Equities
WMK’s benchmark-agnostic direct equity strategy is not concentrated in AI stocks. That positioning has been a headwind to near-term returns, but the portfolio remains filled with quality, growing, cash generative businesses.
The Q2 note highlighted a trade that reallocated profits from significant appreciation in Perimeter Solutions to quality businesses that had faced material drawdowns like Microsoft, Copart and Roper Technologies. On a relative basis, these were well timed investments with Perimeter Solutions falling ~26% on the quarter due to a weaker than anticipated Q2 earnings release (largely driven by contractual pricing weakness that is episodic rather than long-term). Additionally, Microsoft delivered an outstanding 37.8% total return in Q3.
That said, we do not invest for a single quarter’s return. Our focus is on competitive advantages that endure over a 5–10 year horizon. In the current environment, we see several headwinds, including: 1) an unwinding of AI trades, which could ripple through the broader market; 2) macro challenges ranging from inflation to global conflicts; and 3) a U.S. debt burden so large that higher rates constrain not only corporate spending but also the federal government’s ability to respond to challenges with fiscal spending.
These headwinds do not lead us to bunker down or call a crisis. Instead, they lead us to raise our bar for quality and margin of safety. For that reason, we are actively looking to concentrate our positions even further into the most resilient businesses we own with the most exceptional management teams. Paired with strong economic moats, we believe these characteristics position our businesses to compound value over any 10-year horizon.
Required Reserves
Many of WMK’s Partners – including our Founder – own reinsurance entities that carry a benchmark of 90% investment grade fixed income (AGG) and 10% S&P 500 (SPY). We manage these portfolios with as much attention to downside risk as to upside potential. Our first priority is to ensure potential claims can always be supported by these reserve portfolios.
We maintained our underweight corporate bond position during the quarter. Not only have spreads on corporate bonds vs. Treasuries remained stubbornly tight at ~87bps, but there has been material demand for AI capex related debt issuance. Companies that historically generated enormous piles of cash have now turned to debt markets to fund what is quickly surpassing a trillion dollars in AI capex. Companies like Meta, Amazon, Oracle, and now SpaceX are all raising tens of billions in debt on top of some equity issuances. This is not inherently a bad thing in fixed income markets, but the scale is significant: there are only so many dollars available to absorb what could be a 20–25% increase in U.S. investment grade corporate bond supply. We believe this supply/demand imbalance is likely to push spreads wider.
During Q3, our portfolio outperformed its benchmark, primarily due to being shorter duration than the index. At the beginning of Q3 we further reduced duration by selling long-bond exposure and investing further in the 2-year Treasury. With a duration of 4.5 years vs. 5.7 for the index, and a yield to maturity 20 bps above the AGG, the portfolio offers less rate risk and more income than its benchmark.
Closing Thoughts
One of the great privileges of investing is striving to understand the competing forces driving the world, and how interconnected they are. One cannot remove the impact of AI capex from interest rates globally or business strategy locally. AI is now one of the most powerful forces in both the micro and macro environments. It is driving index earnings, swelling corporate bond supply, and shaping the cost of capital for businesses and governments alike.
When so much of the market’s return rests on one theme, we believe discipline matters more, not less. Our response is consistent across our investments: controlling the quality of what we own and the price we pay for it.
Thank you for your continued trust and partnership.
Sources
- Snider, Ben. “Q3 2026 Earnings Season Preview.” Goldman Sachs. October, 2026.
- Van Nieuwerburgh, Stijn. “Financing the AI Buildout.” Columbia Business School. October, 2026.
Disclosures
The views expressed above are those of WMK Investment Partners. These views are subject to change at any time based on market and other conditions, and WMK disclaims any responsibility to update such views.
Past performance is not indicative of future performance. Principal value and investment return will fluctuate. There are no implied guarantees or assurances that the target returns will be achieved, or objectives will be met. Future returns may differ significantly from past returns due to many different factors. Investments involve risk and the possibility of loss of principal. The values and performance numbers represented in this report do not reflect management fees.
WMK may discuss and display, charts, graphs, formulas which are not intended to be used by themselves to determine which securities to buy or sell, or when to buy or sell them. Such charts and graphs offer limited information and should not be used on their own to make investment decisions. To the extent that certain of the information contained herein has been obtained from third-party sources, such sources will be cited, and are believed to be reliable, but WMK has not independently verified the accuracy of such information.